


What is a Poor Plan?
 Plans can be poor because they take a long time to complete or because they consume significant resources. Plans that take a long time to complete can reduce concurrency when the transactions running them hold locks. The first step in identifying a poor plan is to look for lock contention. Determining the blocking SPID can be done by first looking for blocked SPIDs and then by dumping who each SPID is blocked on. Once this is done, it is a simple matter of finding those SPIDs who block others but are not blocked themselves. Below is a simple TSQL that will help you in this direction.
USE Master
GO
— The most commonly used is the exec requests DMV
— We will need the SQL Handle for later use
SELECT session_id, last_wait_type, DB_Name(database_id) database_name, blocking_session_id, sql_handle
FROM sys.dm_exec_requests
WHERE blocking_session_id <> 0
GO
— Or we can use the Waiting tasks DMV for getting the blocking status.
SELECT session_id, wait_type, blocking_session_id
FROM sys.dm_os_waiting_tasks
WHERE blocking_session_id <> 0
GO
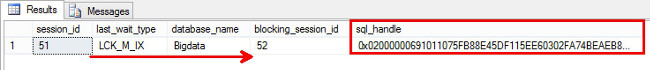
Once the blocking SPID is found, the text it is running can be found by using the SQL text handle with dm_exec_sql_text:
SELECT sql_handle,
plan_handle,
execution_count,
total_worker_time / execution_count as worker_time_per_execution,
total_physical_reads / execution_count as physical_reads_per_execution,
total_worker_time,
last_worker_time,
total_physical_reads,
last_physical_reads,
total_logical_writes,
last_logical_writes
FROM sys.dm_exec_query_stats
WHERE execution_Count > 5 AND total_worker_time / execution_count > 10000
ORDER BY worker_time_per_execution DESC
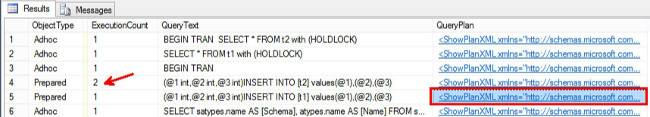
SELECT cp.objtype AS ObjectType,
OBJECT_NAME(st.objectid,st.dbid) AS ObjectName,
cp.usecounts AS ExecutionCount,
st.TEXT AS QueryText,
qp.query_plan AS QueryPlan, st.*
FROM sys.dm_exec_cached_plans AS cp
sys.dm_exec_query_plan(cp.plan_handle) AS qp
sys.dm_exec_sql_text(cp.plan_handle) AS st
— Add the DB filter as required
— WHERE qp.dbid = 10
— If you have the Plan handle then we can get the output too
SELECT * FROM sys.dm_exec_sql_text(0x02000000691011075FB88E45DF115EE60302FA74BEAEB8E80000000000000000000000000000000000000000)
Plans that allocate a significant amount of resources can be found again by blocking. In these cases, blocking is not on a resource semaphore. Another technique that can be used is to profile a running system and to search compiled plans for HASH and SORT operations that are memory intensive. Once a poor plan is found there are a number of techniques to understand and work around the problem.
Why does my query compile slowly?
Queries can compile slowly for a number of reasons. The time to optimize a query is a function of:
- The metadata of the tables used in the query (columns, indexes, constraints, indexed views, etc)
- The size of the tables and other physical structures (number of rows, pages)
- Statistics (created at some point in time in the past over the data in the tables)
- The MAXDOP setting
- The amount of memory on the machine
- Session settings (ANSI_NULLs, etc)
- Cost (which is a function of the size of the tables and statistics)
Many inter-dependent factors impact optimization time and we have listed just few of them. Finding the source of a performance regression can be difficult. Typically, eliminating items from this list is a good approach to find the source of a change and why the problem is occurring suddenly.
Getting into details
There is no one silver bullet you can use when working with plans. There were a number of traceflags that I have seen people use when working with SQL Server plan problems. I am listing just a few of them for your reference and explore each to see how you can learn something new from each.
- To print the Optimizer input/output tree – use Trace Flags: 8606/8607
- To see the Output Plan – add trace flags 8607
- In order to relate output plan to final memo – use Trace flag 8612
- Few more trace flags that help in correlation of plans are – 8672 and 8615
- From a statistics point of view, use DBCC show_statistics. This is something I have been using for decades together.
- To understand which statistics was used by the optimizer – use Trace flag 9204.
- If you determine it is memory related problems, “DBCC MemoryStatus” is an undocumented command that outputs information about the overall system memory status.
Let me give reference to two whitepapers that make a good read.
- Batch Compilation, Recompilation, and Plan Caching Issues in SQL Server 2005
- Statistics Used by the Query Optimizer in Microsoft SQL Server 2005
Plans can get little offset and we can get deteriorated performance. This happens from time to time on most of the systems. As explained earlier, there is no one single silver bullet that will solve. We need to debug them by eliminating one step at a time. Hence this article gives you some direction on where to start and what trace flags one needs to monitor. Irrespective of these trace flags, I highly recommend to try them as there will be loads of learnings that you don’t want to miss. Let me know if you have ever used them in your environments before? What were your learnings? How did you solve the problem?
 Next Steps

For more SQL tips, you might also be interested in SQL Server Performance Architecture for Beginners, an on-demand webinar by SQL expert Rick Morelan. Watch the webinar to learn about:
- Clustered and non-clustered indexes
- Basic storage concepts and terms of the database
- How to read execution plans
Learn more Embarcadero DBArtisan , a database administration toolset that helps DBAs maximize availability, performance and security across multiple DBMSs. And Try DBArtisan for free.