5 Database Reports In SQL Server Management Tools

by Aug 25, 2016

Categories

Tags

Administration agent-based monitoring Agentless Monitoring alert responses alert thresholds alerting Alerts Amazon Aurora Amazon EC2 Amazon RDS Amazon RDS / Aurora Amazon RDS for SQL Server Amazon Redshift Amazon S3 Amazon Web Services (AWS) Analytics application monitoring Aqua Data Studio automation availability Azure Azure SQL Database azure sql managed instance Azure VM backup Backup and recovery backup and restore backup compression backup status Backup Strategy backups big data Blocking bug fixes business architecture business data objects business intelligence business process modeling business process models capacity planning change management cloud cloud database cloud database monitoring cloud infrastructure cloud migration cloud providers Cloud Readiness Cloud Services cloud storage cloud virtual machine cloud VM clusters code completion collaboration compliance compliance audit compliance audits compliance manager compliance reporting conference configuration connect to database cpu Cross Platform custom counters Custom Views customer survey customer testimonials Dark Theme dashboards data analysis Data Analytics data architect data architecture data breaches Data Collector data governance data lakes data lineage data management data model data modeler data modeling data models data privacy data protection data security data security measures data sources data visualization data warehouse database database administration database administrator database automation database backup database backups database capacity database changes database community database connection database design database developer database developers database development database diversity Database Engine Tuning Advisor database fragmentation database GUI database IDE database indexes database inventory management database locks database management database migration database monitoring database navigation database optimization database performance Database Permissions database platforms database profiling database queries database recovery database replication database restore database schema database security database support database synchronization database tools database transactions database tuning database-as-a-service databases DB Change Manager DB Optimizer DB PowerStudio DB2 DBA DBaaS DBArtisan dBase DBMS DDL Debugging defragmentation Demo diagnostic manager diagnostics dimensional modeling disaster recovery Download drills embedded database Encryption End-user Experience entity-relationship model ER/Studio ER/Studio Data Architect ER/Studio Enterprise Team Edition events execution plans free tools galera cluster GDPR Getting Started Git GitHub Google Cloud Hadoop Healthcare high availability HIPAA Hive hybrid clouds Hyper-V IDERA IDERA ACE Index Analyzer index optimization infrastructure as a service (IaaS) infrastructure monitoring installation Integrated Development Environment interbase Inventory Manager IT infrastructure Java JD Edwards JSON licensing load test load testing logical data model macOS macros managed cloud database managed cloud databases MariaDB memory memorystorage memoryusage metadata metric baselines metric thresholds Microsoft Azure Microsoft Azure SQL Database Microsoft PowerShell Microsoft SQL Server Microsoft Windows MongoDB monitoring Monitoring Tools Monyog multiple platforms MySQL news newsletter NoSQL Notifications odbc optimization Oracle PeopleSoft performance Performance Dashboards performance metrics performance monitoring performance schema performance tuning personally identifiable information physical data model Platform platform as a service (PaaS) PostgreSQL Precise Precise for Databases Precise for Oracle Precise for SQL Server Precise Management Database (PMDB) product updates Project Migration public clouds Query Analyzer query builder query monitor query optimization query performance Query Store query tool query tuning query-level waits Rapid SQL rdbms real time monitoring Real User Monitoring recovery regulations relational databases Releases Reporting Reports repository Restore reverse engineering Roadmap sample SAP Scalability Security Policy Security Practices server monitoring Server performance server-level waits Service Level Agreement SkySQL slow query SNMP snowflake source control SQL SQL Admin Toolset SQL CM SQL code SQL coding SQL Compliance Manager SQL Defrag Manager sql development SQL Diagnostic Manager SQL Diagnostic Manager for MySQL SQL Diagnostic Manager for SQL Server SQL Diagnostic Manager Pro SQL DM SQL Doctor SQL Enterprise Job Manager SQl IM SQL Inventory Manager SQL Management Suite SQL Monitoring SQL Performance SQL Quality SQL query SQL Query Tuner SQL Safe Backup SQL script SQL Secure SQL Security Suite SQL Server sql server alert SQL Server Migration SQL Server Performance SQL Server Recommendations SQL Server Security SQL statement history SQL tuning SQL Virtual Database sqlmemory sqlserver SQLyog Storage Storage Performance structured data Subversion Support tempdb tempdb data temporal data Tips and Tricks troubleshooting universal data models universal mapping unstructured data Uptime Infrastructure Monitor user experience user permissions Virtual Machine (VM) web services webinar What-if analysis WindowsPowerShell

When connecting to a SQL Server instance in SQL Server Management Studio, there are built in reports for databases you can use for free. These RDL files or SQL Server Reporting Service reports use DMVs and DMFs to retrieve meta-data about databases. You do not need to know anything about DMVs or DMFs to use them. These reports are great free tools given to us by Microsoft.

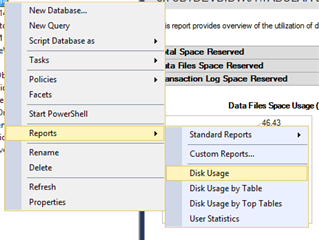
The first one I use a lot is the Disk Usage report. If you right-click a database, select Reports from the sub-menu, then Standard Reports, you will see Disk Usage.

Figure 1: Reports menu

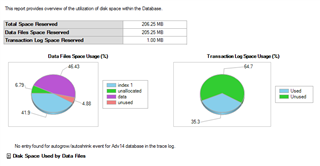
The report gives you a lot of information. First, you get a graph of the Data Files Space Usage with percentages. The Transaction Log is on the right. Above the graphs is a table with more details about the data and transaction log files. Below the graphs are expandable lists for used space as well as growth of files.


Figure 2: Disk Usage report


The next report used frequently is the Disk Usage by Table. You can access it through the same method above, but by selecting Disk Usage by Table instead.


Figure 3: Disk Usage by Table menu


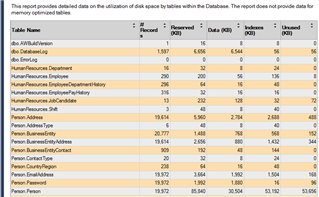
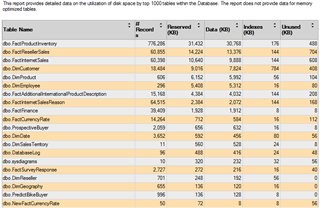
This report gives you an alphabetically sorted list of tables in your database. It has columns for # of records, Reserved Space in MBs, Data in KBs, Index space in KBs and Unused space in KBs.


Figure 4: Disk Usage by Table


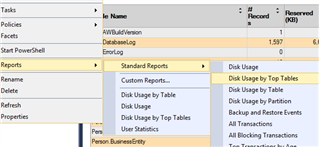
The alternative to the last report is Disk Usage by Top Tables.


Figure 5: Disk Usage by Top Tables menu


This reports is the same as the last (list of tables in database) but sorted by the Size for Data column.


Figure 6: Disk Usage by Top Tables


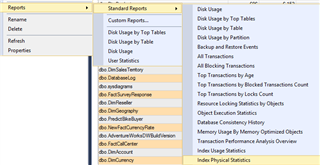
The forth report I like is Index Physical Statistics.


Figure 7: Index Physical Statistics menu


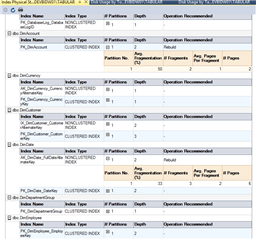
This report helps you locate indexes that are fragmented. There is a lot of info in this report with expandable list for Reorganize and Rebuild suggestions.


Figure 8: Index Physical Statistics


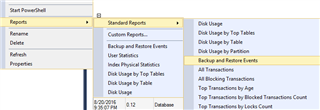
The last report for now will be the Backup and Restore Events.


Figure 9: backup and Restore report


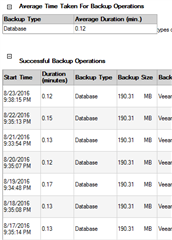
This report will have expandable areas for Average Time and Backup Operations to show how long on average backups and restores were taking as well as a list of Full, Incremental and TLOG backups including the location.


Figure 10: Backup and Restore report


As you can see, these are only 5 of the 10+ reports available from SQL Server Management Studio by default for databases. If you know how to run a profile trace, you can capture the query used to produce the reports and start you own logging of database information.

Thomas