Several versions ago, SQL Diagnostic Manager (SQLDM) introduced Alert Configuration Templates, which basically allowed users to preconfigure alert settings (metrics which are to be alerted upon and the thresholds set for those metrics). This was a great addition to SQL Diagnostic Manager at the time as it allowed users to apply the alert settings to one or more monitored SQL Server instances with a few simple clicks. Without further ado, let's jump into SQLDM to see how the Alert Configuration Templates can be used.
First, we need to find where the Alert Configuration Templates are located. In the SQL Diagnostic Manager Desktop Client, go to Tools > Alert Configuration Templates which will open the Alert Templates window as shown below.
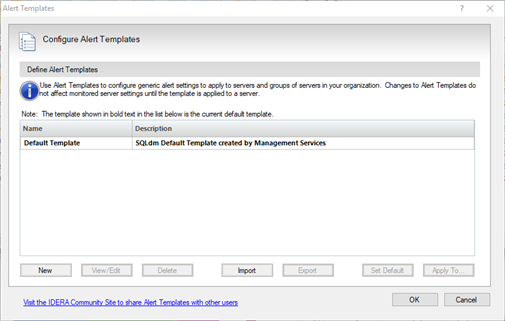
On the Alert Templates window, a list of existing alert templates is shown. In the image above, I only have the Default Template available, which is the one that comes preconfigured with a new installation of SQLDM. From here, you have the ability to create, view/edit, delete, import, export, set a default template, and apply the template to monitored SQL Server instance(s). Since I only have the Default Template available and I don't want to alter the settings there (I like to keep original settings where possible), let's start off by creating a new template by clicking the New button which will open the Add New Template window.
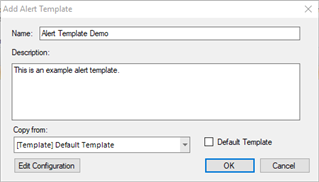
The Add Alert Template window is pretty straight-forward. You simply have to provide a name, a description of the template, and a source template from which the alert settings should be copied from. The Default Template option, if enabled, means that the alert settings defined by this alert template will automatically be applied to any newly registered SQL Server instance. If I clicked the OK button at this point, I would have cloned the original alert template. That's not what I want to do at this point since I actually want to have different alert settings, so I'll be clicking the Edit Configuration button.
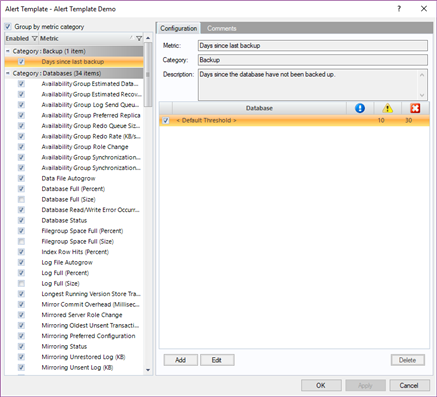
On the window that appears, this is where I'll be enabling/disabling metrics and setting the metric thresholds. Enabled metrics are the ones that SQLDM will be generating alerts on. On the flip side, disabled metrics are ones that SQLDM will ignore and not generate alerts on. To configure a metric threshold, you must first select a metric which will then populate the settings on the right-hand side of the window. For example, in the screenshot below, you can see a short list of metrics which are enabled and also see the threshold settings for the Days since last backup metric.
NOTE: As you select different metrics, the thresholds settings may appear to be different. That is because each metric can be measured differently. I'll save the explanation of the different settings for another blog entry.
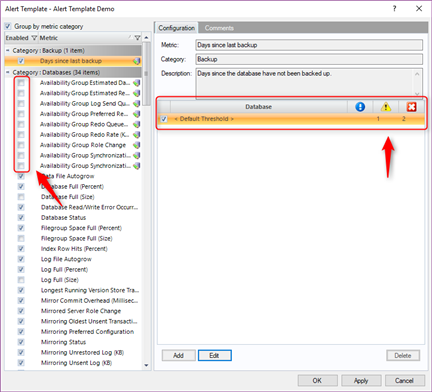
To keep this example simple, I'll disable all of the "Availability Group" metrics and update the Days since last backup metric threshold settings so that 1 day would be a warning status and 2 days would be a critical status.
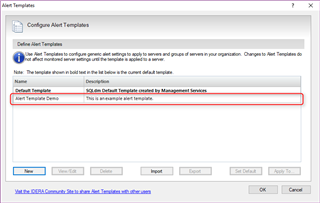
Click OK to save my changes and click OK again on the Add Alert Template window. At this point, SQLDM will ask if you want to apply the newly created and configured alert template to existing SQL Server instances monitored by SQLDM. Before you apply, there is something very important that you must understand regarding how templates are applied. Keep in mind that the alert template is one entity with various settings within it. It's a list of enabled and disabled metrics, as well as a list of threshold setting for all metrics. When an alert template is applied to a monitored instance, SQLDM will overwrite the monitored instance's current completely with the settings defined in the alert template. I typically compare this to a rubber stamp. You're going to get the exact design of the stamp when you apply it. I suppose another way to compare it would be the idea of using a snapshot. You restore the entire snapshot, not just small parts of it. In this example, I'm going to select the No option as I don't want to apply the template right away, which will then take me back to the Alert Template window where I can see that my template was created successfully.
If you'll notice, the template that's designated as the "Default" (the one that gets automatically applied to newly registered instances) is listed in a bold font. That helps easily determine which of the templates are being applied to new instances.
That just about covers what I really wanted to discuss regarding alert templates. One thing that I would suggest, just because I like to have backups, is to export the template and save it in a safe location. It'll come in handy in case your settings accidentally get overwritten or deleted.
If you want to learn more about SQL Diagnostic Manager, check out the product page for more information

