Uptime Database Infrastructure Monitor triages large environments so that you can quickly determine what needs your immediate attention, Database Down. Instances that are stopped or imminently unavailable are highlighted in red. Availability is tested via ping, process/service running, and successful sign-in & query.
Many monitors create a fog of numerous alerts. This wastes time as a DBA has to figure out what is truly important and what is not. Uptime database infrastructure monitor focuses on what you need to know first. Fixing the problem can be automated. Uptime can execute a script to restart a service for example. Uptime will then retest to make sure that the fix succeeded. Automation makes your life easier.
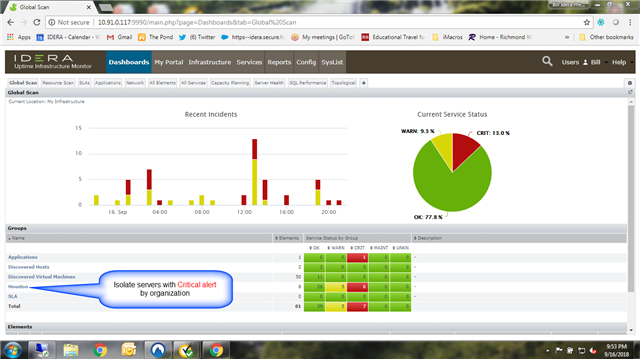
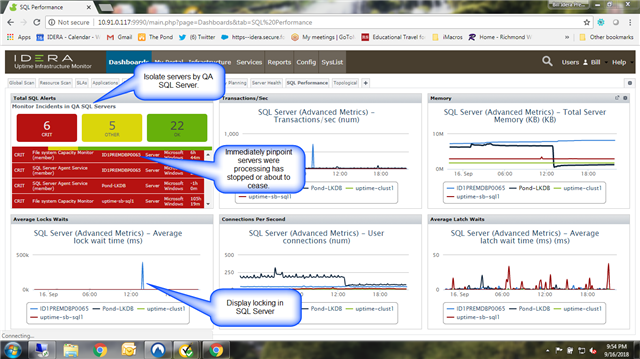
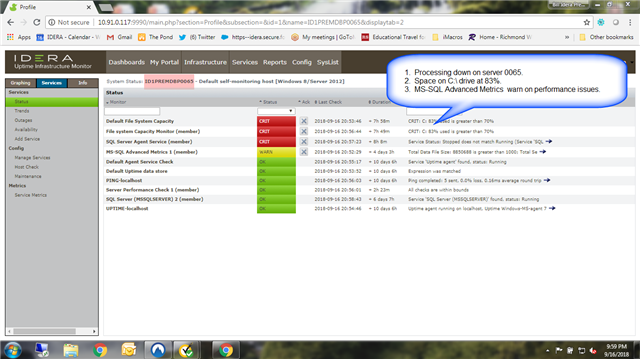
These three screens show how to quickly assess a large environment:
- Isolate an organizational grouping (Houston) that needs your attention
- Focus on the SQL Server instances grouped in QA, trend the crucial metrics
- Pinpoint a particular server & instance that is down / performance problems.
Down Databases By Organizational Grouping:

Focus on SQL Server QA Instances

Pinpoint a particular server & instance
Uptime Database Infrastructure Monitor covers Oracle, DB2, SQL Server, Sybase, MySQL, Postgres, and many additional components of your production environment. Uptime provides a blanket quickly showing the instances that need your immediate attention in a large environment; Precise provides the deep dive for locking / blocking, wait state performance optimization. Precise measures the sessions and SQL Statements. The Precise difference is high resolution visibility at extremely low overhead.
If you’d like to see how Uptime & Precise can make your job easier, please request a meeting and we will show you: Request a Demo.
