The talk of the town these days is around Big Data if you are in a data-related domain. Most of the top CIOs are trying to get onto this bandwagon of Big Data and want to implement the same within their organization. Organizations have had data and loads of data inside their premises for ages and they have been doing all kinds of reporting, prediction, and analysis on top of this data. So what makes this concept of Big Data really unique? As a matter of fact, there is nothing unique about it – it is just the process that follows that makes it unique.
In this article, we will take a different approach of understanding the nuances of Big Data and what is this process that industry is trying to talk about? How should we systematically approach the same?
 |
Watch the video: Do you have the right database administration tools? Embarcadero DBArtisan is the premiere database administration toolset helping DBAs maximize availability, performance and security across multiple DBMSs. This essential toolset consistently boosts productivity, streamlines routine tasks, and reduces errors. |
Understanding the general approach
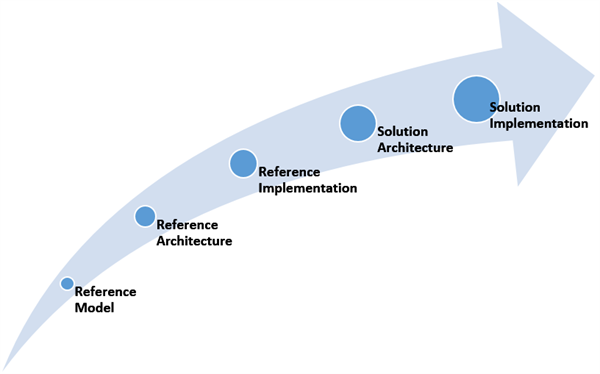
There are some high level terminologies we see when building a robust architecture, these are high level conceptual ideas that we thought are worth a mention.
| Reference Model | This is the foundational building block and built on top of a domain. These models are agnostic of the technology used. |
| Reference Architecture | This step defines the rules and patterns for the domain. These are the logical structure and pave way for specific implementation. |
| Reference Implementation | This is the physical deployment of a defined Architecture. Suitable as a solution or multiple implementations can be done using different technologies. |
| Solution Architecture | Looks into specific requirement and expands on the implementation. It honors to rules of architecture. |
| Solution Implementation | This is the specific implementation of the solution defined with technology development and deployment plans. |
Understanding the Big data phenomenon
The industry always talks about Big Data in the lenses of 3 V’s (Volume, Velocity and Variety). Our fundamental understanding is if the data over runs the current capacity of processing of relational databases, then we are most likely looking at a Big data scenario. There are number of implementations of big data and it need not always be about being big, the “V” of variety makes the solution of implementation of big-data really messy.
When we say it is messy, we mean it is about analyzing or dissecting large amount of loosely structured data and performing distributed aggregations around them. In the enterprises of this era, we are sometimes talking about multi-petabytes, billions of transactions per day/week, incomplete textual data (social for example) and much more.
Let us outline some of the terms used in this context:
- HDFS – Hadoop Distributed File System, file system used for storing and retrieving data.
- HBase – NoSQL Tabular store can complement HDFS
- Cassandra – NoSQL Eventually consistent Key value stores
- Java – coding language used to perform Map-reduce jobs
- Pig – High level language reducing the need for Java understanding
- Hive – mimics a DW layer on top of Hadoop
- Mahot – data mining and machine learning libraries
- Spark – Compute engine for HDFS data
- Zookeeper – coordination engine for distributed applications
Knowing your Enterprise dataflow
We would like to put into perspective of how data flows into any enterprise system:
This is a simple process and there are multiple tools that help us in this process. Let us take a simple example of some tools available in the Microsoft ecosystem to illustrate the same.
With this growing trend, in the current era – know how the Big Data solution would be implemented. Today, we can implement it as an on-Premise, Cloud only or Hybrid. One of the question we ask is – “Is data born in the cloud and does it always stay in the cloud”.
Identify
ETL
- As part of acquisition of data, it can come in multiple ways.
- Streaming data like from a CEP interface.
- SQOOP – Bulk transfer from SQL and Hadoop.
- Flume – Log file aggregation services.
Cleanse and store
- Can use ETLs like SSIS as part of cleaning
- Evaluate any Data quality solutions to identify wrong / missing data.
- HDFS – Storage of petabytes of data in a distributed fashion.
- HBase – NoSQL DB on top of Hadoop.
- SQL APS – massively parallel processing architecture for RDMS structured data.
Analyze
- MapReduce – a programming model used for processing, and refining, data across very large data sets.
- Hive – a Service that runs on the Head node and accepts HiveQL queries.
- Pig – Provides a Pig-latin language that creates MapReduce tasks to operate over data in HDFS.
- Mahout – a batch oriented data mining solution for Hadoop data stores.
- Pegasus – a peta-scale graph mining system providing scalable algorithms such as PageRank, Degree, capable of handling graphs with billions of nodes and edges.
- CEP like SQL Server StreamInsights – Provides high-throughput, low-latency complex event processing (CEP) for near real-time analysis.
Visualize
- Simple day-to-day tools like Excel can be used easily via Power BI capabilities.
- SharePoint can be used to expose via PowerView, PowerPivot, Excel Services and more.
- Any reporting solution can be used to consume and visualize these data analysis like – Cognos Insight, MicroStrategy Visual Insight, Oracle Exalytics Appliances, SAS Visual Analytics and many more.
Conclusion
As you start your journey with Big Data, know your environment and build the solution in a phased manner. If we don’t know where we need to go, we will never be helped by any map. So know what the parameters we want to analyse. Clean the data, scrub for invalid outliners and then analyse for the majority 80% content. Big data implementation is a journey and we need to take one step at a time. Hope this blog brought out some of the facets.
|
About Pinal Dave Pinal Dave works as a Technology Evangelist (Database and BI) with Microsoft India. He has written over 2000 articles on the subject on his blog at http://blog.sqlauthority.com. During his career he has worked both in India and the US, mostly working with SQL Server Technology – right from version 6.5 to its latest form. Pinal has worked on many performance tuning and optimization projects for high transactional systems. He has been a regular speaker at many international events like TechEd, SQL PASS, MSDN, TechNet and countless user groups. |
||


