Capacity planning, especially when done for Microsoft SQL Server, is not for the faint of heart. Storage and disk capacity are apparent, but to right-size databases for a new SQL Server implementation or migration, there is a lot more than space to consider. Of course, sizing and future growth need to be considered. Also, it is critical to review the design, configuration, and other essential resources to ensure that the new SQL Server is performing optimally. Plan for future capacity for SQL Server with IDERA SQL Diagnostic Manager.
Capacity Usage Chart
The Capacity Usage chart in the Summary view of the Database tab displays the usage of data and logs in the databases. This chart provides information on the text, tables, and indexes space, as well as the unused space of the databases. Refer also to the documentation View your SQL Server databases information.
Analysis Reports
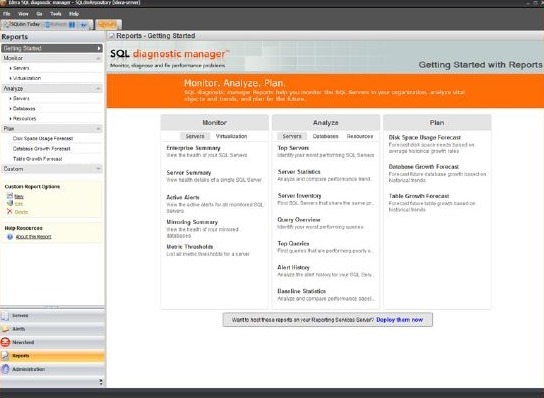
Analysis reports provide information to analyze the current effectiveness of SQL Server systems. Analysis reports are instrumental when performing a consolidation or moving to another environment (such as the cloud). Refer also to the documentation Analysis reports.
Server Analysis Reports
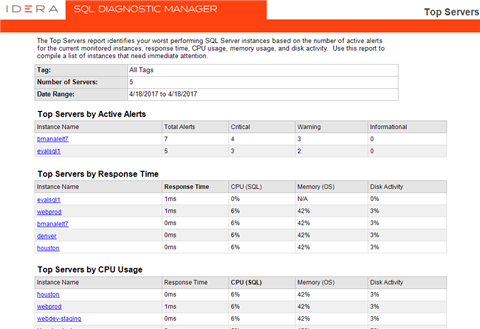
- Top Servers: Identify the worst performing SQL Servers.
- Server Statistics: Analyze and compare performance trends across two SQL Servers.
- Server Inventory: Find SQL Servers that share the same properties.
- Query Overview: Identify the worst performing queries.
- Top Queries: Find queries that are performing poorly or executing too frequently.
- Alert History: Analyze the alert history for a SQL Server.
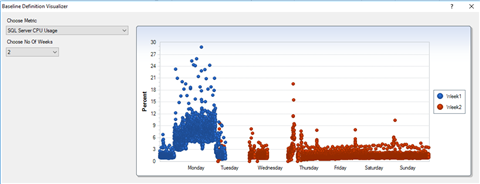
- Baseline Statistics: Review and compare metric and baseline values across two SQL Server instances.
Baseline Statistics Report
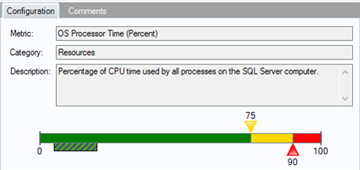
The Baseline Statistics report analyzes and compares baselines within a single SQL Server instance and across two instances. When viewing baseline statistics for a monitored SQL Server instance, compare the baseline metric values at two different times or two different metrics at the same time. Include another instance and compare baselines values occurring at the same time or different times. View trends in the average value of a metric for a SQL Server instance and how this value changes over time for capacity planning. Baselines can be calculated related to past performance. Additionally, multiple baselines can be set up to provide a better understanding of what is "not normal" taking into consideration the time of day (for example, production hours versus maintenance hours). Refer also to the documentation Baseline Statistics server analysis report.
Database Analysis Reports
- Top Databases: Identify the worst performing databases.
- Database Statistics: Analyze and compare performance trends across two databases.
- Top Database Applications: Find database applications that consume system resources.
- Mirroring History: Analyze the event history for a mirrored database.
- Top Tables by Growth: Identify the fastest growing tables.
- Top Tables by Fragmentation: Identify the most fragmented tables.
- Tempdb Statistics: Analyze performance statistics for the tempdb database.
- Transaction Log Statistics: Analyze the use of the log files.
- Availability Group Statistics: View the historical health of the availability groups, availability replicas, and availability databases.
Resource Analysis Reports
- Session Statistics: Track key session and network performance metrics over time.
- CPU Statistics: Track key CPU performance metrics.
- Disk Details: Track key disk metrics.
- Disk Space Usage: Obtain an overview of the available disk space across the SQL Server environment.
- Disk Space History: View the history of activity for a specific disk.
- Disk Statistics: Track key metrics for disk performance.
- Replication Statistics: Track key metrics for replication performance.
- Memory Statistics: Track key metrics for memory performance.
Plan Reports
Use the Plan reports to forecast for future needs based on historical growth trends. Exploit the history of the collected data to predict the amount of space consumption required at the table, database and volume levels for a point in time in the future.
Choose linear or exponential (aggressive) forecasting types when running Plan reports.
- Linear forecasting follows the trend of the available data and extends the forecast out in a straight line by the number of forecast units.
- Exponential forecasting tends to exaggerate the trend that exists in the data to more easily see if data is trending toward or away from a critical threshold. If the rate of growth is not constant, the exponential forecast type gives a more accurate forecast of future growth.
Refer also to the documentation Plan reports.
Disk Space Usage Forecast Report
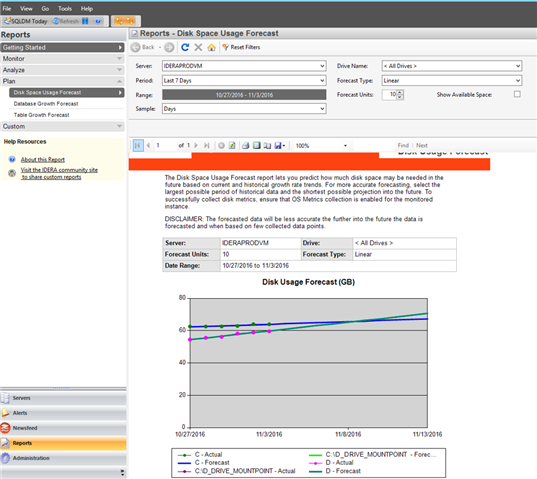
The Disk Space Usage Forecast report forecasts disk space needs. This report predicts how much disk space is needed in the future based on current and historical growth rate trends. Run this report to help anticipate the needs and plan for future acquisition of disk space.
Database Growth Forecast Report
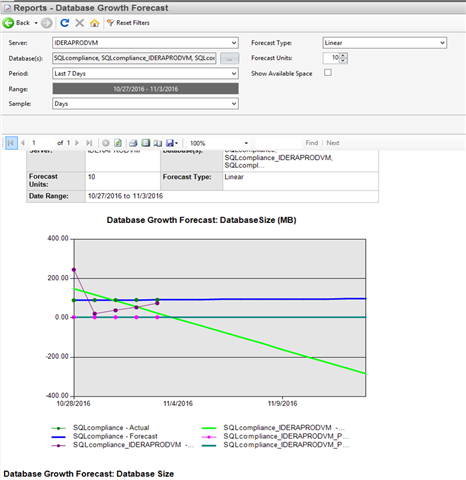
The Database Growth Forecast report forecasts future database growth. This report predicts how large selected databases may grow based on current and historical growth rate trends. Run this report to help anticipate the needs and plan for future database expansion.
Table Growth Forecast Report
The Table Growth Forecast report forecasts future table growth. This report predicts how large selected tables may grow based on current and historical growth rate trends. Run this report to help anticipate the needs and plan for the future creation of additional tables.
Custom Counters and Reports
Every environment is different. SQL Diagnostic Manager has canned metrics that are monitored and collected historically for review, and canned reports. Having the ability to extend this monitoring footprint is paramount. Obscure monitoring requirements will be necessary. Having a tool that adapts to the environment is crucial.
Custom Counters
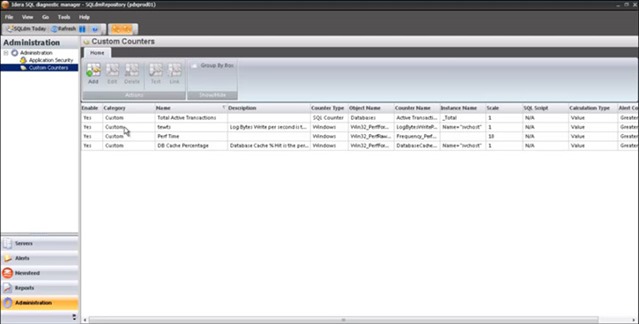
In addition to monitoring a wide variety of the most common SQL Server and operating system performance metrics, add additional performance metrics via custom counters. Add any Windows system counters including any Performance Monitor and Windows Management Instrumentation (WMI) counters. Also, add any SQL Server system counter stored in the "sysperfinfo" system table, and any numerical value that custom SQL scripts return. Also, add and any performance counters accessible through the virtual machine and host server. Refer also to the documentation Use custom counters to track metrics.
Custom Reports
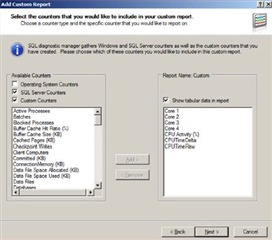
Create or edit custom reports. Include in custom reports any collected metric, including custom counters. Choose the counters to include in a report, order the way the metrics appear, and specify the aggregation method used on each of the metrics. Refer also to the documentation Custom reports.
Refer also to the webcast Capacity Planning Done Right for SQL Server.
abstract:
Penton Tech contributing editor and industry expert Robert Pearl digs into what you need to equip yourself with – and how you need to plan – before you deploy your next SQL Server. This will include disk size, memory, I/O, indexes, transaction logs, file growth, current utilization stats, and more.
Subsequently, Bullett Manale from IDERA will discuss how to gather data concerning the current usage and growth trends of databases for capacity planning. In this session, you will view database capacity usage for data and logs; see database file statistics for available and used space for data and logs; review and compare metric and baseline statistics; identify fast-growing tables; predict future disk space, database, and table needs from growth forecasts. You will also see how to create custom usage and trend reports using any pre-defined and custom counters.
community.idera.com/…/0647.Capacity-Planning-Done-Right-for-SQL-Server.mp4
Download a fully functioning 14-day trial of SQL Diagnostic Manager, request a one-on-one demonstration, or request a price quotation.

