The Precise Application Performance Platform measures end-users transactions from “click to disk”. If the most resources are consumed within the .NET tier, that would warrant a deeper investigation. Let’s take a look. One multi-application health dashboard and four in depth screens are shared with you to illustrate root-cause analysis.
Precise’s multi-application health dashboard calculates health based on availability and speed. While each location may show as healthy, individual transactions may need your attention.

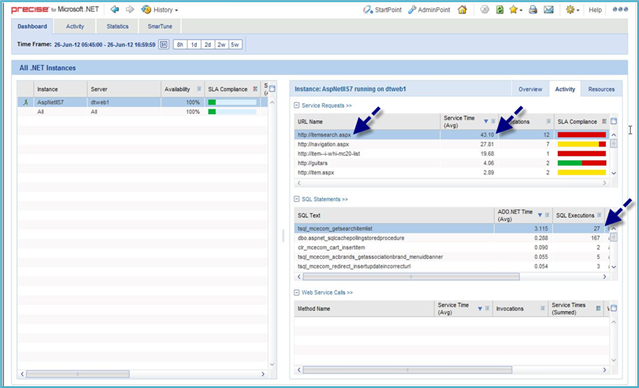
The Activity tab shows the transaction outliers executing business logic that are impacting the end-user experience and not meeting the performance SLA. “ItemSearch” takes 43 seconds and calls the database repeatedly. The Activity Tree below shows more details. Click to enlarge.

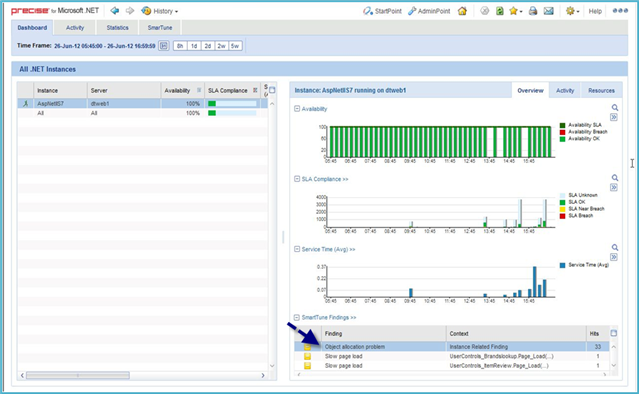
The overview tab looks pretty good, but we’d like all transactions to meet the SLA goal including the outliers pinpointed above.

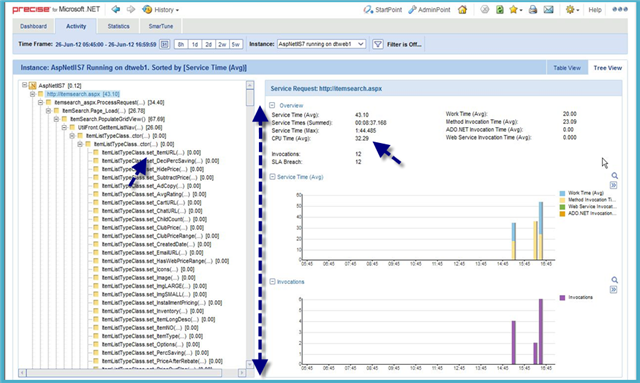
The Activity Tree shows the invocation context so that developers and admins can see what is driving the resource consumption. The heaviest entry point is “ItemList”. It is expensive due to the number of sets. Each set is like nothing, but they add up. There are so many sets that the scroll bar is long (shown as blue dotted line added to GUI).
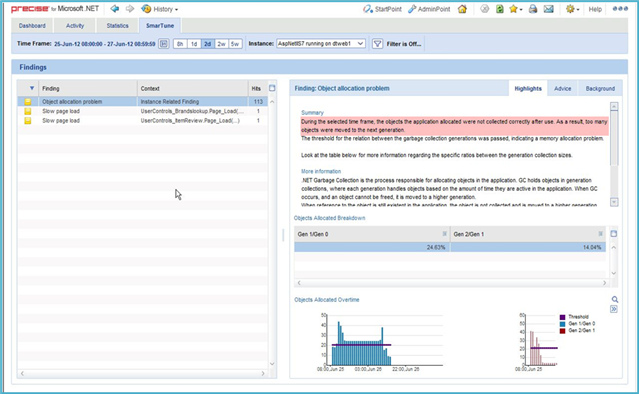
Precise’s Finding screen automatically pinpoints the processing bottleneck and offers recommendations. Best of all, Precise measures continuously so that when a change is made, you can see the result: management by measurement.
If this interests you, please click “See It In Action” via Learn More.

