My life for the last 2 years has been a constant battle of putting out fires with system performance; finally user complaints have moved getting this resolved as my top priority.
Let’s see how I tackled the problem…
Symptoms:
- Very High Disk Latency as high as 300,000 milliseconds (ms) is not unusual
- Average: 900 – 15,000ms
- Memory Pressure
- Slow User Experience
Problem:
- Bad hardware
- Over-provisioned VM Hosts (what happens on one VM effects the other)
- Old NetApp SAN
- No infrastructure budget for new hardware
Challenge: Make the system viable with no hardware changes or tweaks
Step 1: Brain Storming (in no particular order)
- Reduce I/O
- I can probably tune a ton of old stored procedures
- I need to do a full review of all indexes
- Reduce blocking
- Investigate daily data loads
- How is the data loaded?
- Can it be improved?
 Step 2: Reduce I/O & Investigate daily data loads
After doing some research, it was found that we were truncating 48 tables daily with over 120 million records as part of our morning load. The process was taking over 2 hours to complete each morning and would often cause blocking. During this time users would run reports and complain data would not return in a timely manner. So I thought maybe this would be a great place to start.
I also noticed we were loading 8 tables to keep them “real time for reports” once every hour. This resulted in a total of 9.6 million records being truncated and subsequently reloaded, taking approximately 17 minutes of every hour.
Solution: Implement transactional replication instead of doing hourly and morning truncate and reloading of tables.
Outcome: Once implemented the disk I/O dropped drastically and disk latency reduced to an average 200ms. The morning load times dropped from 2 hours to 9 minutes and the hourly load went to 5 seconds down from 17 minutes. Now, the disk latency is not optimal still but better. Best practices say it should be below 20ms.
This solution was difficult to accomplish because of all the work that went into it. Once the replicated tables were stable, I first identified which stored procedures were utilizing those tables (I used Idera’s SQL Search for this). Then I changed each procedure to read tables from new location.
Next, I had to change any SSRS reports that had hard coded calls to those old tables (Note: don’t do this. Always use a stored procedure). Finally, I looked for any views that called the tables and adjusted those as well.
In two weeks’ time, over 500 stored procedures, reports and views were manually changed.
It is probably worth noting that this was all done in Production simply because we do not have a test environment for this system. Yes, I did get a few bumps and bruises for missing a few table calls in store procedures or typo’s or nasty collation errors that arose. These were bound to happen and some changes I was not able to test during the day. All in all it went really well. Having a test environment would have alleviated these, but not all of us have the luxury.
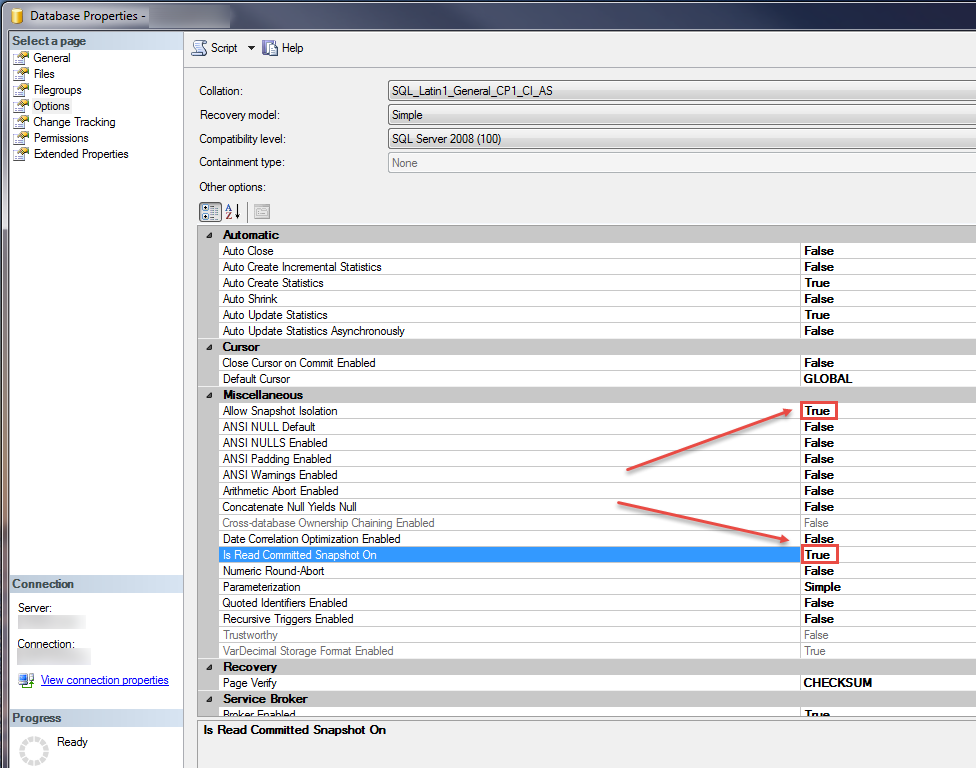
The OOPS: Unfortunately, not long after I implemented the first couple of tables I began to notice blocking. When I investigated I found it to be replication. I forgot a very important step, which thanks to a blog post by Kendra Little I was able to quickly identify and solve. I needed to turn on Allow Snapshot Isolation and Is Read Committed Snapshot On. Her blog was a HUGE help. You can read at her blog all the details as to why this is important here: http://www.littlekendra.com/2016/02/18/how-to-choose-rcsi-snapshot-isolation-levels/ . Once those to options were implemented the replication ran seamlessly and the blocking disappeared.
Step 3: Index Review
First of all, I always preach as a Lone DBA don’t waste your time reinventing the wheel, use what is out there. So I turned to the trusted scripts from Glenn Berry (B|T). You can find them here: https://sqlserverperformance.wordpress.com/2016/06/08/sql-server-diagnostic-information-queries-for-june-2016/ . I am not going to supply snippets of his code, feel free to down load them directly from his site to review.
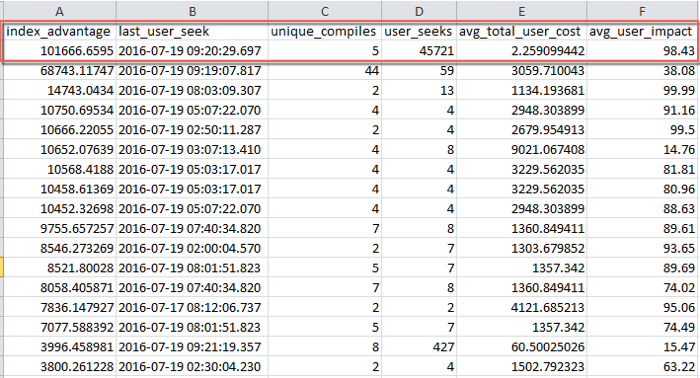
I started by reviewing duplicate indexes and deleted\adjusted accordingly where needed. Then I went on to looking for missing indexes (where some magic happens). This reduced the amount of I/O because it lessened the amount records that had to be read due to using proper indexing.
Now just because these scripts stated they were missing I didn’t just create them; I evaluated their usefulness and determined if they were worth the extra storage space and overhead. Glenn’s script gives you a lot of information to help decide on the index effectiveness. As you can see with the first one in the result set, if the index was added over 45,000 user seeks would have utilized it and query cost would drop on average by 98.43%. Again I didn’t arbitrarily add this index because it was in the list. Once I determined I would not be creating a duplicate or similar index on the table and given the potential of better performance with the suggested index, it was added.
Oh one more OOPS…(why not, learn from my mistakes)
After going thru the indexes exercise and adding indexes to the tables (in the subscriber), I lost all of them minus the Primary keys. Yep, made one change to a replicated table and the replication reinitialized; all my indexes were dropped. Needless to say I was not a happy camper that day. Lucky for me each index I added was scripted and put into a help desk ticket. I was able to go back thru all my tickets and resurrect each index I needed. Now, to be smart, I have scripted all of them and place those into one file, so I can re add them all if needed in future. I haven’t found a way around this yet, so if anyone has any information on how to feel free to let me know.
Step 4: Performance Tune Slow Stored Procedures (the fun part for me)
Armed with Grand Fritchey’s (B|T) book on Execution plans for reference I began tuning any stored procedure I was aware of that was taking more than 2 minutes to run. In total, I tuned about 77 of them, most were report related or part of data loads. I found many benefited from indexes being placed on temp tables within the procedures. Others were doing too many reads based on bad WHERE clauses or joins.
Another thing I ran across was functions used in where clauses or joins. Example of which is date conversion functions that were converting both From and To Dates used a BETWEEN statement. The functions caused each date value to be processed by the function before being evaluated by the WHERE clause, causing many more reads then necessary. To work around this I read in the data and converted the dates into temp table, then did my JOINS and WHERES on the already converted data. Alternatively, depending on what the statement was I also converted the value and placed in variable for later evaluation.
There were so many more things I came a crossed and tuned such as implicit conversions, table spools, and sorts that were not optimal. All of these were fixed by little code changes. I am not going into all of that because this post would be quite long, but you get the point.
Happy Side Effects: After cleaning up the tables and implementing replication I actually free up 300 GB of storage and greatly reduced our backup and restore times.
Summary:
Things are running much better now; introducing Replication reduced enough disk I/O to keep the system viable. For now latency now hovers on average between 2 and 200 milliseconds, which is a vast improvement. I do, however, still see spikes in the thousands of milliseconds and users still complain of slowness when they run large ad-hoc queries within the application (JDE Edwards E1). Unfortunately, that goes back to hardware and the application itself which are things that I cannot improve upon. The good news is, I am hearing a rumor that we will be installing a Simplivity solution soon. I am very excited to hear that. I’ll blog again once that solution is in place and let you know how that goes.


