Run new and existing PowerShell scripts with SQL Diagnostic Manager and utilize the vast power of PowerShell via the customizable monitoring environment. Run scripts to automatically react to problems detected by the monitoring environment, deploy and manage the monitoring environment via cmdlets, connect existing scripts to the monitoring environment to automate their execution, and avoid writing certain scripts in the flexible yet simple monitoring solution.
What Is PowerShell?
Microsoft’s Windows PowerShell is a task-based command-line shell and scripting language. PowerShell is designed especially for system administration. PowerShell is becoming increasingly common as an automation tool for database administrators. Built on the .NET Framework, PowerShell controls and automates the management of the Windows operating system and the applications that run on Windows.
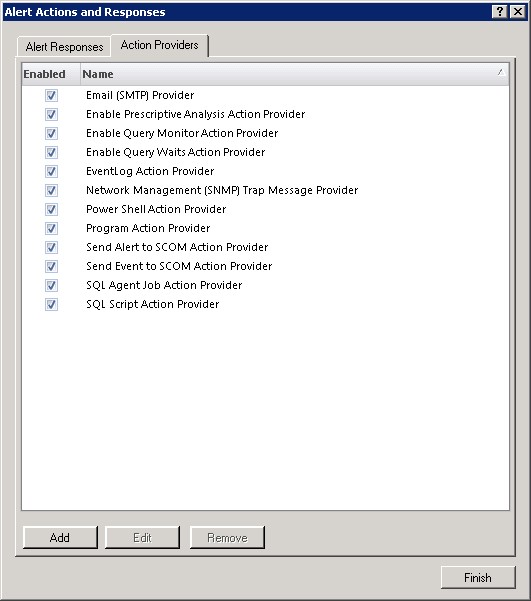
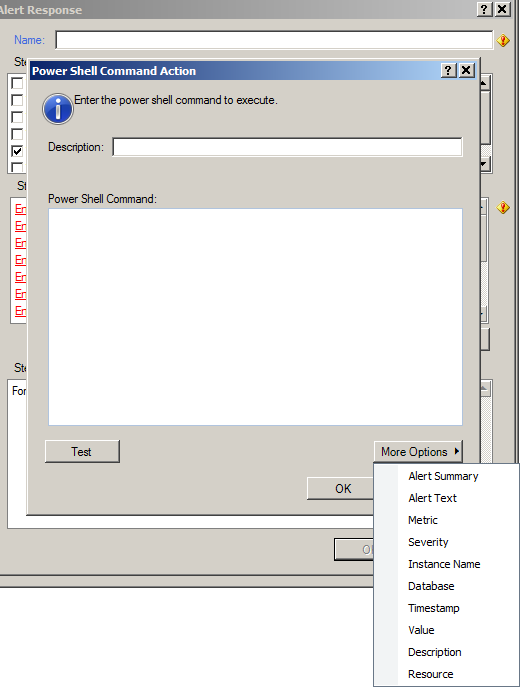
PowerShell provides an operating environment for commands that include cmdlets, functions, filters, scripts, aliases, and executables. SQL Diagnostic Manager provides cmdlets via its PowerShell provider and executes scripts via its PowerShell alert action provider.
PowerShell operates within a hosting application that exposes a command line to the user. It uses a host interface to communicate with the commands invoked by the command line. Utilize a console application, a Windows application, or a web application as the hosting application.
For more information, refer to Microsoft’s Developer Network – Documentation “Getting Started with Windows PowerShell”, Microsoft’s TechNet Library “Scripting with Windows PowerShell”, and Microsoft’s Script Center – Learn “Windows PowerShell Scripting”.
Automate SQL Diagnostic Manager Functions with PowerShell
SQL Diagnostic Manager provides a PowerShell action provider to execute scripts as the result of alerts. SQL Diagnostic Manager also provides a PowerShell snap-in to allow scripting of everyday activities (such as listing servers, managing monitored servers, listing active alerts, and managing application security of SQL Diagnostic Manager). Respond to alerts on SQL Server metrics, automate the deployment of SQL Diagnostic Manager, and customize the properties of monitored instances of SQL Server. Real world examples include enabling maintenance mode for all instances, create and apply monitoring templates, intensify monitoring activity, and decrease monitoring activity.
Respond to Alerts on SQL Server Metrics with PowerShell
With SQL Diagnostic Manager, automatically respond to alerts on SQL Server metrics by executing PowerShell scripts. Manage alert response rules and criteria via the action provider for PowerShell.
For more information, refer to SQL Diagnostic Manager’s product documentation “Configure Automated Responses to Alerts – PowerShell Action Provider”.
Automate the Deployment of SQL Diagnostic Manager with PowerShell
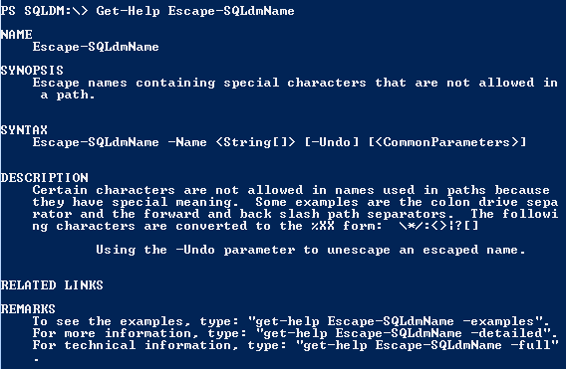
Automate the administration of the implementation of SQL Diagnostic Manager with PowerShell cmdlets. For instances of SQL Server, retrieve a list of instances on the network, add and remove instances to monitor in SQL Diagnostic Manager, configure the options on monitored instances, and specify server names containing special characters. For SQL Diagnostic Manager, manage permissions of SQL Diagnostic Manager on a server, control users of SQL Diagnostic Manager, toggle application security for SQL Diagnostic Manager, set the logging level of the provider of SQL Diagnostic Manager, and create a drive for connecting to the repository of SQL Diagnostic Manager.
For more information, refer to SQL Diagnostic Manager’s product documentation “PowerShell Cmdlets for SQL Diagnostic Manager”.
 |
| The output from PowerShell’s ‘Get-Help Escape-SQLdmName’ cmdlet in the PowerShell console. |
Customize Properties of Monitored SQL Server Instances with PowerShell
Use PowerShell cmdlets to customize the properties of instances of SQL Server that are monitored by SQL Diagnostic Manager: Edit the general settings; customize the settings for the monitoring of queries, query waits, and activity; exclude applications, databases, and SQL statements from the monitoring of queries customize the settings for disabling of the collection of statistics on replication; customize the collection of statistics on tables; and customize the settings for maintenance mode.
Edit the general settings: For the collection of data, toggle the extended collection of data, and specify the frequency of the scheduled collection of data and the collection of statistics on databases. Set and clear friendly names for monitored instances, enable, define a value for, and disable the limiter for the input buffer, associate and disassociate tags to a server. For security, set the credentials for SQL Authentication, toggle the encryption of connections, and toggle the certificates for trust servers.
Customize the settings for the monitoring of queries: Toggle the monitoring of queries, enable using SQL Trace and Extended Events, toggle the collection of actual and estimated query plans, set up the thresholds for duration, logical disk reads, CPU usage and physical disk writes, and enable the capturing of SQL batches, SQL statements, stored procedures, and triggers.
Customize the settings for the monitoring of query waits: Toggle the collection of statistics on query waits, toggle using Extended Events, and set the collection to a specified time and duration and indefinitely.
Customize the settings for the monitoring of activity: Enable using SQL Trace and Extended Events, toggle capturing database autogrow and blocking, and set the threshold for blocking processes.
Customize the collection of statistics on tables: For collection during quiet time, specify the time of day, the days of the week, the minimum table size to collect reorganization statistics, and the list of databases to exclude.
Customize the settings for maintenance mode: Toggle maintenance mode, and set maintenance mode to recurring and one-time. For recurring maintenance mode, set the days of the week, the start time, and the length of time. For one-time maintenance mode, set the start and end date and time.
Refer also to the video “Using the SQL Diagnostic Manager PowerShell Snap-In”:
| www.idera.com:443/…/SQL DM – Using the Powershell snap-in.mp4 |
For more information, refer to SQL Diagnostic Manager’s product documentation “Customize your Monitored SQL Server Properties within PowerShell”.

