The Precise solution gathers a lot of information across all tiers of web-based applications, as well as database activity. This data is stored in the Performance Management Database (PMDB) with a three-year history. It is often useful to pull data out of the PMDB for use by custom reports. And while the PMDB schema is open and documented, custom reports are an easy way of creating SQL statements that can be run outside of Precise.
This blog post describes Precise customer reports: how they are created, how data is selected, how this data is formatted for presentation, how they are run, and contains an extra bonus pro-tip at the end!
PRECISE CUSTOM REPORTS
The out-of-the-box reports in Precise are generated as PDFs. They can run on a user-defined schedule and can be emailed to users. Custom reports are generated as Excel workbooks but can also be scheduled and emailed. Custom reports have data and formatting that you select.
In creating a custom report, you use the Precise GUI to create one or more SQL queries that return data you are interested in. When the report is run, each query is outputted to an Excel worksheet. You can then use the graphs, charts, and other features and functions of Excel to format and present your data. Precise saves the workbook with this formatting. When you rerun the report, the underlying worksheets with data are repopulated, and the formatted worksheet (with your charts and graphs) reflects the new data.
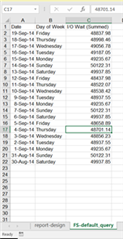
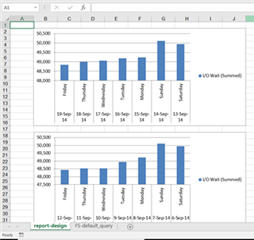
The worksheet on the left, “FS-default_query,” shows the output from the query that you created within Precise. The worksheet on the right, “report-design,” shows how you have formatted the data from the other worksheets. Precise saves this workbook, including the “report-design” worksheet, on the FocalPoint server. When the custom report is rerun, Precise will repopulate the “FS-default_query” worksheet with new data. Your “report-design” worksheet will now reflect the updated data. This is a simple report. A complex custom report can have any number of “FS-“ worksheets, each with their own SQL statement, each repopulated when the report is rerun. You can also create multiple “report-design” worksheets.
CREATING A CUSTOM REPORT
Creating a new custom report is straightforward. I will refer you to the Precise Report Manager User Guide for details. The new report will have a single “default_query,” but you can rename this or add any number of queries.
CREATING A QUERY FOR A CUSTOM REPORT
There are two main sections to each query: report fields and a filter table. The report fields are the columns or data that you are interested in printing in the report. You can define groupings and sort orders. These could be user, statements, dates, execution counts, SLA compliance, or anything else in the PMDB. The filter table is the “WHERE” clause of the SQL statement. You can specify what conditions must be met for the report elements.
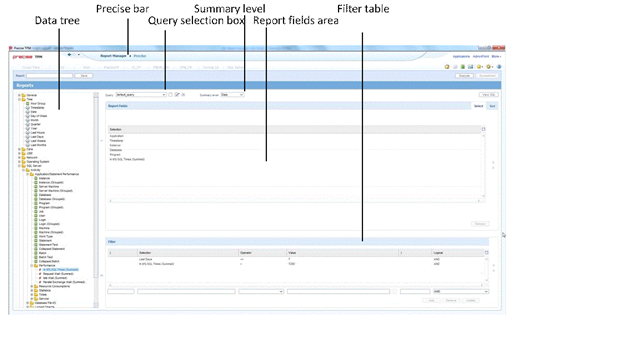
Notice that there is a “Summary Level” drop-down above the report fields. This selects whether your query will use the time slice, daily, weekly, or monthly tables. I have written another blog post that goes into the details of how these tables are populated. Just be aware that the daily tables (the default) will never contain data for today. The most common mistake is to write a query to pull data for the last several hours but to leave the summary at “daily.” You will get no data returned.
EXECUTING AND SAVING A CUSTOM REPORT
After you have created your report fields and filters, you use the “Execute” button to run the report. An Excel workbook will be opened up on your desktop. You will have a worksheet called “report_design” and another called “FS-default_query.” You can use the full features of Excel to create graphs, charts, and other features on the “report_design” worksheet. After you have made your changes, save the workbook in Excel. Precise will then save the workbook on the FocalPoint server.
BUILDING A REPORT
The advice I give to anyone writing their first report is to start simple. Very simple. Ridiculously simple. Create a report that shows all of the databases in an environment. You can select “SQL Server -> Objects -> Database” element and add it to the Report Fields section. Then execute the report.
The key to developing useful reports is to start this simple and to add one single thing (a report field or a filter) and execute the report. If you try to develop a moderately complex report from scratch, it’s easy to make a mistake and get no data returned. That’s why I recommend to start simple and make one change at a time.
BONUS PRO-TIP: HOW TO CREATE COMPLEX PRECISE SQL STATEMENTS TO BE USED OUTSIDE OFF PRECISE
Notice that there is button labeled “View SQL.” This button is very handy for viewing the SQL statement that is generated by your selection of report fields and filters. You can copy this SQL statement to run outside of Precise, as part of a custom alert, or as part of a “retrieve-from-database” portlet in the Application Services Dashboard (the Precise dashboard).
SUMMARY
Precise Custom Reports are good for presenting important data that is unique to your environment. Whether it is reporting on late night ETL functions, critical business SLA compliance, throughputs in processing, or any of the other data that Precise collects, custom reports allow you to pull any data from the PMDB and use the features of Excel to present the data in your chosen format. I encourage you to start simple and build up a report. You can use the scheduling and emailing functions within the Precise Report Manager to run your new custom report on a regular schedule and to automatically email it when it is generated.
You can find documentation about Precise Reports and the PMDB here: http://wiki.idera.com/display/Precise/View+all+Precise+9.8.x+PDFs