


Memory leaks in java and .NET can cause major performance issues with the application. Precise helps you to detect those memory leaks.
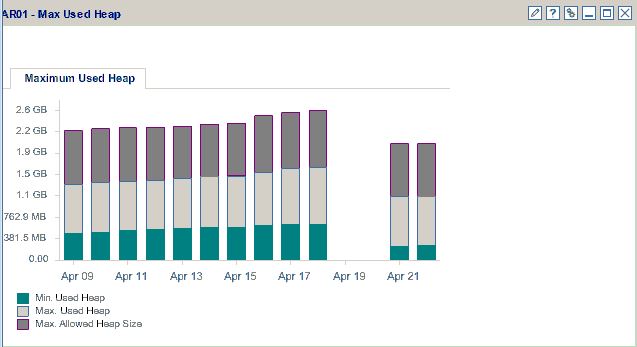
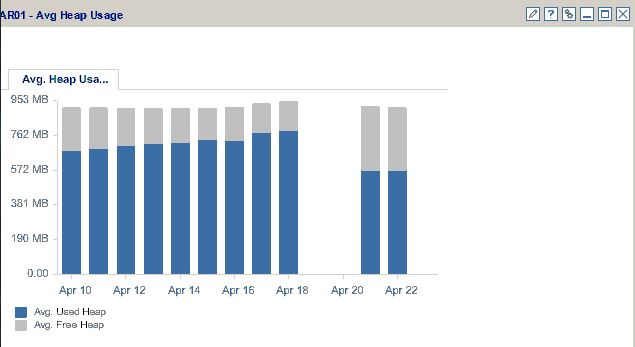
In java, Precise monitors the jvm heap size and usage. It indicates when the heap size grows as shown in the screenshot below.
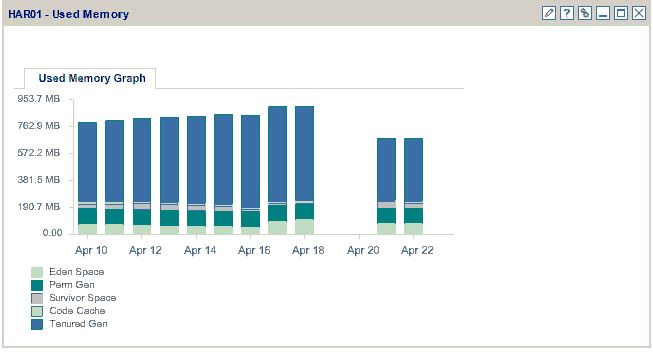
It can show how much space is consumed by the different gen pools as shown below.
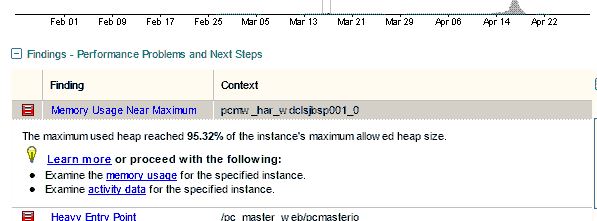
Precise automatically detects when heap usage is exceeding its expected size and alerts you through its findings and hot spots. In this example we can see that it is showing memory usage has exceeded 95%
Precise shows you the growth in memory and helps identify the memory issues.
Precise also helps to identify leaks and does this by identifying those methods that are keeping many objects live and not closing them.
This is a clear indicator that objects are not being released correctly by the allocating method. By identifying those methods with a large number of live objects we can then investigate them further to understand why they are allocating such a large number of objects that remain open.
Case Study
The following is a case study showing a customer that was complaining of memory issues.
With Precise we were able to identify the high memory usage as shown in the findings screenshot below.
We can see a large amount of memory was allocated as shown in the screenshot below.
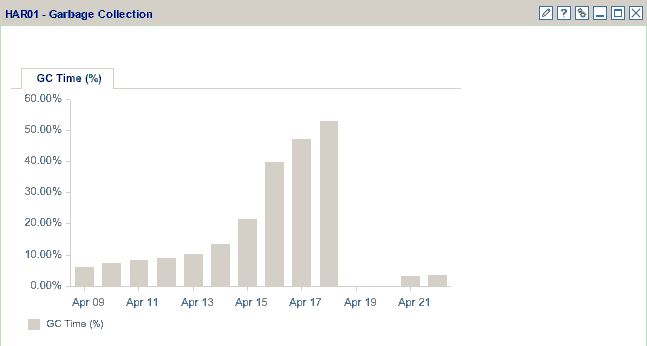
We noticed that there is also a high amount of time in Garbage Collection. We can see a figure of up to 60% for garbage collection for this JVM. Anything more than 5% is considered to be a performance issue. This large amount of time is due to carrying out major garbage collection which is the clearing of objects that have remained in the Tenured Gen pool for some time.
This is an indicator that many objects are being kept open.
We used the Precise Leak Seeker to then identify those methods that were allocating and keeping open a large number of objects.
We can see from this screenshot that there were certain methods that had a large number of objects open. Some of these methods had close to 600,000 objects open at any one time.
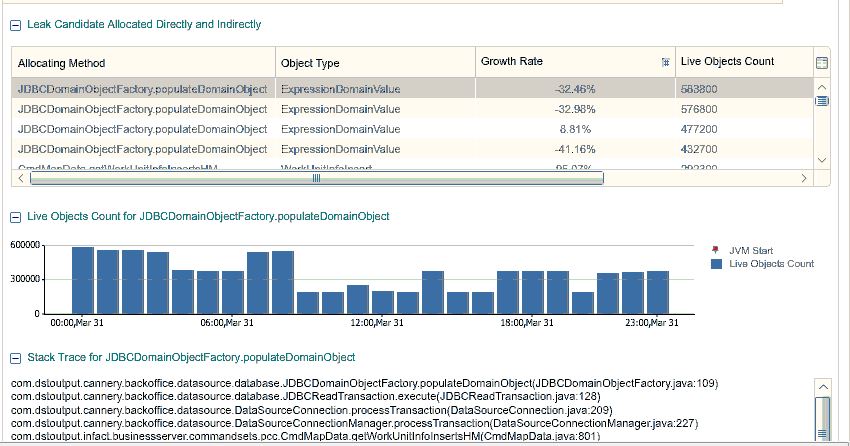
By looking at the selected method we can see from the Live Object Count graph a large number of objects open in this time period. We can see that on average there are more than 300,000 objects open at any one time.
This was the case for a number of different methods as shown below.
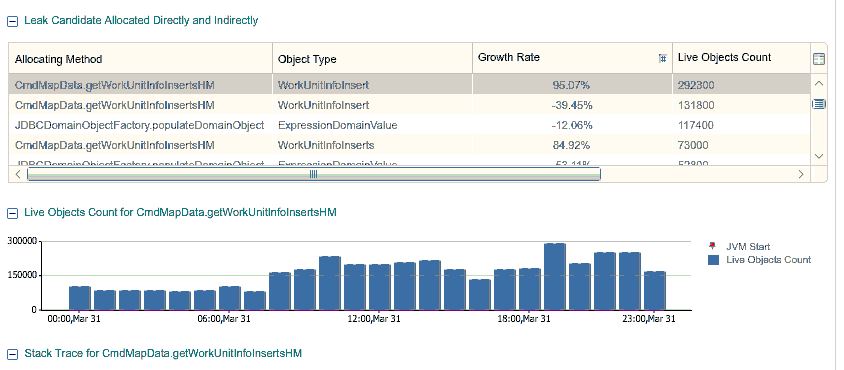
By identifying the methods that are allocating the large number of objects, the customer was then able to investigate why they were allocating and not releasing the objects.
Summary
By using Precise to quickly identify the methods that were creating the large number of objects we are able to quickly identify the source of the memory leak.
Precise gives this ability to quickly identify the issues without the need to manually capture data and carry out a lengthy analysis of the problem.
Our Professional Services team carry out detailed performance investigations and assessments for our customers.
Call us to help resolve your performance issues quickly.