We are pleased to announce that SQL Diagnostic Manager 9.1 will soon be available for beta testing.
Please note that this will be pre-release code and may be subject to certain defects. Your assistance in reporting any issues you may encounter, or any feedback on the new features you are working with, is greatly appreciated and will help us to achieve the goal of a quality release that meets your expectations. Please use this forum to provide feedback.
What’s New in Diagnostic Manager 9.1?
- Refined integration with the Idera Dashboard. Access aggregated views and functions for all your SQLdm repositories connected to the Idera Dashboard. Launch the SQLdm Console from various views.
- Improved web console views. Re-designed thumbnail and heatmap views for an enhanced visual overview of your monitored SQL Server environment plus new widgets for practical access to specific information.
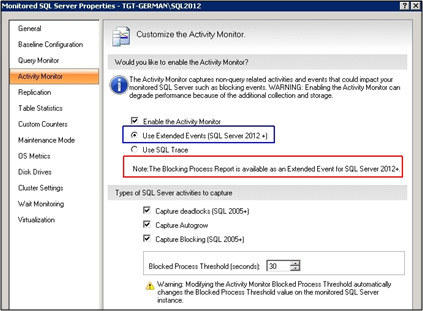
- Activity Monitor now supports Extended Events for instances running SQL Server 2012+.
- Integration with the Idera community site. Import or share custom counters, custom reports, and alert templates with the Idera DBA community.
- Filegroup and Mount Point monitoring improvements such as configurable database filegroup alerts, new Disk Size view for key statistics on all monitored disk drives, and new Disk Space Usage reports.
- Monitoring of the SQL Server Active Directory Helper and SQL Server Browser services plus inclusion of these services in the Server Summary report.
Idera Dashboard Improvements
- The Idera Dashboard now contains two new tabs: Overview and Details view.
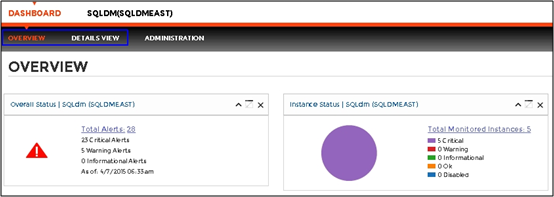
The Overview and Details View tabs contain product widgets. When you register SQLdm with the Idera Core Web Framework you can publish widgets, and also specify which widgets appear in the Overview and which in the Details View by default.
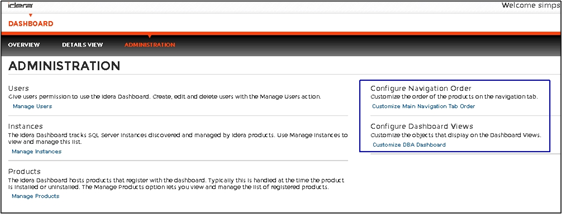
- The Administration tab of the Idera Dashboard now contains two new widgets to perform administration-related actions: Configure Navigation Order and Configure Dashboard views.
- Launch the SQLdm console directly from the Thumbnail and Heatmap sub-views, and the Alerts Detail screen by clicking the SQLdm icon

SQLdm Web Console Improvements
Thumbnail view:
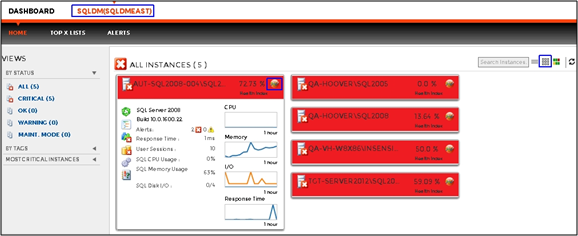
- The Thumbnail view is now sorted by criticality of worst alert and it includes 1 hour line graph views of CPU, Memory, I/O, and Response Time.
- Click the server name to access the single instance dashboard and click a category icon to access a specific view in the single instance dashboard.
Heatmap view:
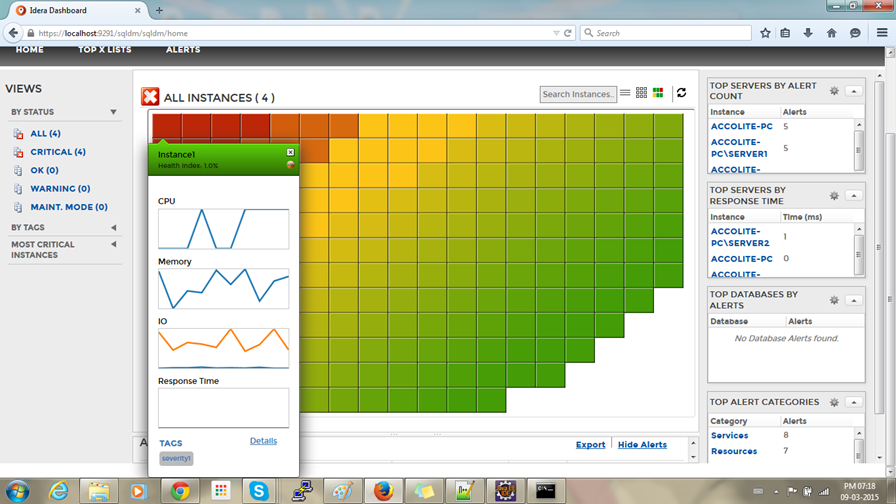
- The Heatmap view is now a grid of squares that contains a health index with color coded status. Colors range from green, as in healthy, to red, as in critical.
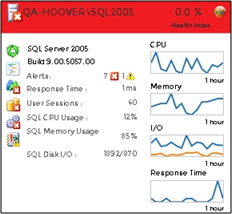
- Each square in the Heatmap view represents a monitored instance. To glance at instance basic information just hover over a specific square. If you want more details click the selected square.
- Upon clicking a specific square, information on the health index displays along with 1 hour line graph views of those metrics causing health degradation. Here you can also click Details to access the Overview tab of the single instance dashboard.
SQLdm Improvements
- In the Activity Monitor tab, you can now select to collect non-query activities data (Deadlock, Autogrow, and Blocking) using Extended Events:
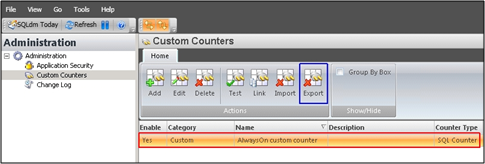
- Import/export custom counters. To export a custom counter, select Administration > Custom Counters in the navigation pane. Then select the custom counter you wish to export from the list and click Export.
- To import a custom counter, open the Custom Counter Wizard by clicking Administration > Custom Counters, and then clicking Import in the Custom Counters view. Just follow the wizard to complete the import process.
- Import/export custom reports.To import a custom report, open the Custom Reports Import Wizard by clicking the Import button in the Custom Report Options tree. Just follow the wizard to complete the import process.
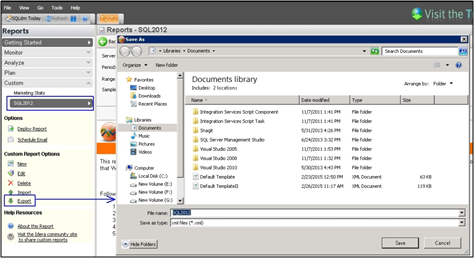
- To export a custom report, click Export in the Custom Report Options and indicate in which folder you want to save the custom report XML file.
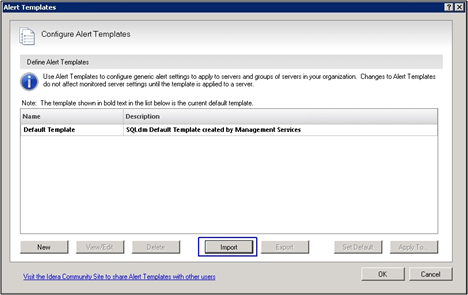
- Import/export alert templates.To import an alert template, select Tools > Alert Configuration Templates and click Import. Just follow the wizard to complete the import process.To export an alert template, follow the previous steps but instead select the Export option.
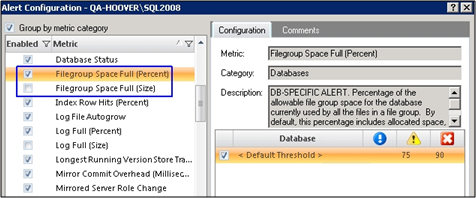
- Use two new configurable filegroup alerts: Filegroup Space Full (Percent) and Filegroup Space Full (Size).
- Get key statistics on the way your disks are used on the computer hosting your SQL Server instance with the new Disk Size view:
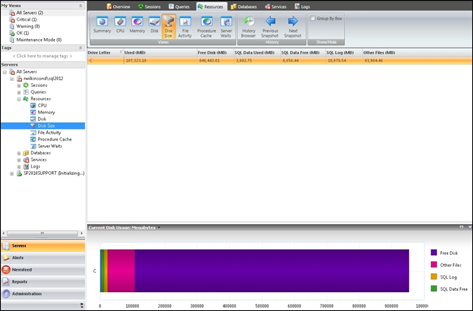
You can open the Disk Size view by selecting the appropriate SQL Server instance, and then clicking Disk Size in the Views group of the Resources tab.
Try two new reports to easily identify servers with available disk capacity:
- Disk Space Usage report- provides an overview of the available disk space across your SQL server environment.
- Disk Space History report- provides the history of activity for a specific disk.
As normal with a beta release, please do not install in a production environment or upgrade your primary Diagnostic Manager installation. Upgrades from the beta release will not be supported and an uninstall and re-installation will be necessary to move to the final release.
If you are interested in participation in the beta test of Diagnostic Manager 9.1 please e-mail scott.stone@idera.com