In week 3 of our series, Benefits of SQL Diagnostic Manager for MySQL, we discuss how to identify and analyze problematic SQL queries using SQL Diagnostic Manager for MySQL. If you missed it, feel free to read our previous post on Agentless Monitoring and Cloud Readiness.
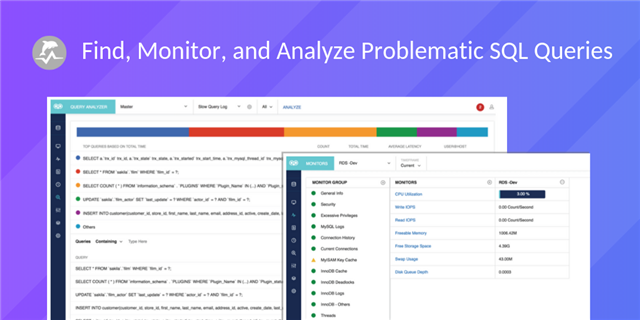
Find Problematic SQL Queries
MySQL and MariaDB currently lack advanced tools for profiling SQL queries (such as SQL Profiler of Microsoft’ SQL Server). While other monitoring tools for MySQL and MariaDB provide monitoring and advisory information on various system metrics, they do not pinpoint the problematic SQL queries. No amount of hardware upgrades and tuning of the parameters in the database server configuration file ‘my.cnf’ and the database server initialization file ‘my.ini’ can match the performance gains that are achievable when identifying and rewriting problematic queries and creating appropriate indexes.
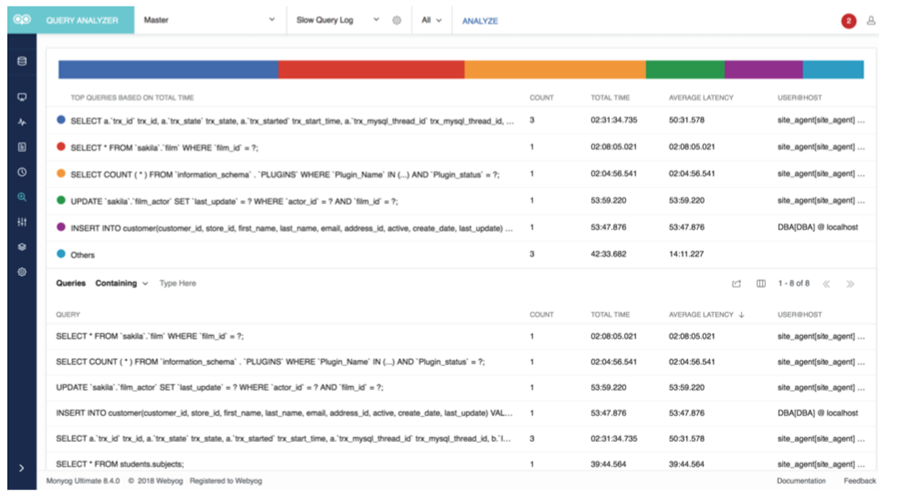
SQL Diagnostic Manager for MySQL finds problematic SQL queries by:
- Querying the MySQL Proxy application that clients and applications are configured to connect through
- Analyzing slow query logs
- Analyzing general query logs
- Issuing the SHOW PROCESSLIST statement at regular intervals Utilizing Performance Schema tables
Additionally, export the reports created by the above methods as comma-separated values (CSV) files. The export functionality means that it is possible to further customize the report using a spreadsheet and by directly importing the comma-separated values (CSV) output into a MySQL and MariaDB table for further analysis.
Monitor and Analyze SQL Queries
Identifying problematic SQL queries (that is, by looking at slow query logs, general query logs, the Performance Schema feature, the SHOW PROCESSLIST statement, and the MySQL Proxy application) is important. However, this analysis is usually performed well after the problematic SQL queries executed. Consequently, real-time notifications for long-running queries are needed. SQL Diagnostic Manager for MySQL continuously monitors SQL queries in real-time. It sends notifications (via email, simple network management protocol (SNMP), the collaboration platform Slack, the incident response platform PagerDuty, and the messaging logging standard syslog) for SQL queries that take more than a specified amount of time to execute. It is also possible to specify an option to automatically kill such queries.
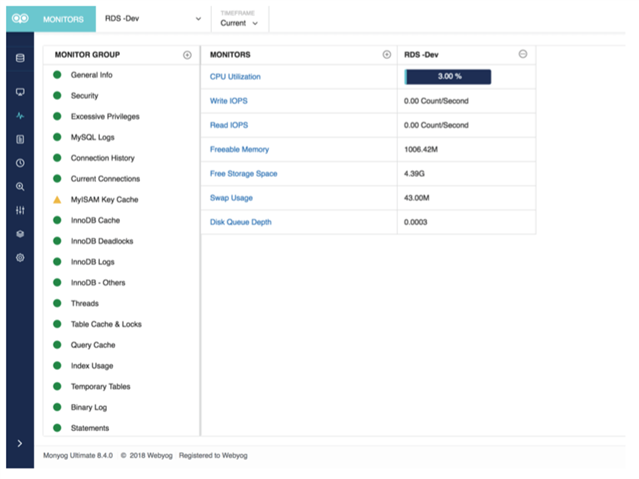
Monitor Amazon RDS and its Operating System
SQL Diagnostic Manager for MySQL provides monitoring capabilities for Amazon RDS for MySQL, MariaDB, and Amazon Aurora and its operating system. It uses the application programming interface (API) of Amazon CloudWatch. It uses the different metrics for the operating system that are available with the application programming interface (API) to fetch and display the data. All of the operating system monitors for Amazon RDS are shown under the monitor RDS/Aurora Instance Metrics group in the Monitors page. The corresponding charts are available on the Dashboard page. Just enable system metric for the Amazon RDS Aurora instance to see the data for the operating system.
Read more in the full solution brief.
Find and fix MySQL performance problems on-premises and in the cloud with SQL Diagnostic Manager for MySQL.