SQL Diagnostic Manager is a robust performance monitoring, alerting and diagnostics solution for SQL Server. It proactively notifies of health, performance, and availability problems via a desktop console, a web console add-on, and mobile device. It minimizes costly server downtime with agent-less, real-time monitoring and customizable alerting for quick diagnosis and remediation. Five crucial features of SQL Diagnostic Manager are prescriptive analysis, history browser, tempdb monitoring, custom counters and custom dashboards, and query analysis.
1 Prescriptive Analysis
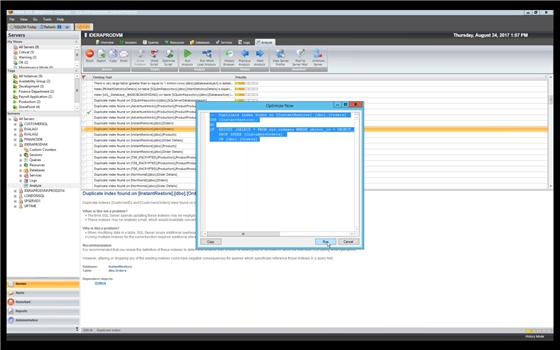
Run a prescriptive analysis on a specific SQL Server instance to identify and resolve SQL Server performance problems. The analysis engine scans the SQL Server configuration for potential problems and the health of the databases. The scan results in a useful set of recommendations for improving performance. Prescriptive analysis targets some of the most common areas of SQL Server performance problems (such as queries, server configuration, security, database objects, and memory). The interface is easy to use which makes the prescriptive analysis feature accessible to a broad range of users.
2 History Browser
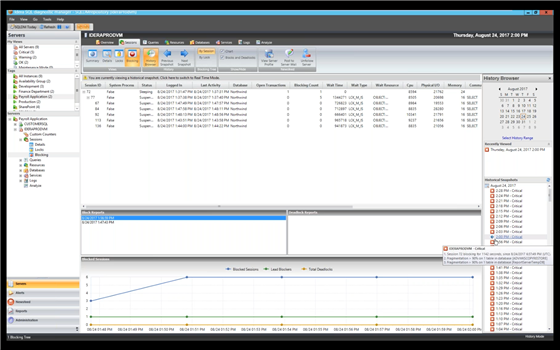
The History Browser provides information about the state of the SQL Server instance when taking a standard snapshot. Use this information to diagnose and resolve issues to keep the issue from happening again. Select a historical snapshot collected by the standard refresh with the History Browser and view the data that was collected using almost all of the real-time views of SQL Diagnostic Manager. By default, store session details and inactive alerts for 31 days and store standard metric information for 365 days. To select a specific snapshot in time in the History Browser, open the History Browser, select the date from the calendar or select the time range to filter the number of snapshots displayed, and select the corresponding snapshot from the Historical Snapshots list.
3 Tempdb Monitoring and Analysis
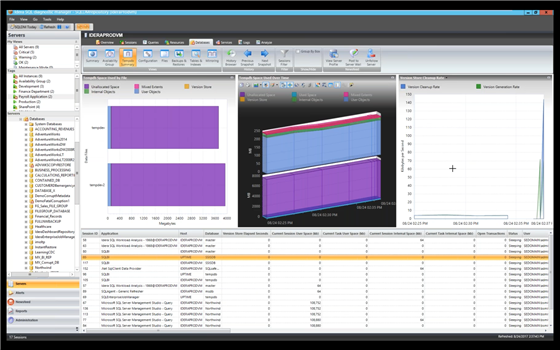
The Tempdb panel tracks the status of the tempdb database on the monitored SQL Server instance. Unexpected spikes in the use of tempdb usage and space may warn to allocate additional space to prevent tempdb issues from causing a performance issue on the server. The Tempdb Space Used chart provides different views of the usage of the database over time based on the object type. The Tempdb Contention chart provides the latch wait time for the allocation pages of the tempdb. The Version Store Cleanup Rate gauge displays the current version store cleanup rate and the version generation rate of the data rows necessary to support snapshot isolation.
4 Custom Counters and Custom Dashboards
Fully customize the monitored and displayed counters, and fully customize the Dashboard that displays the panels with the health and performance of SQL Server instances.
4.1 Custom Counters
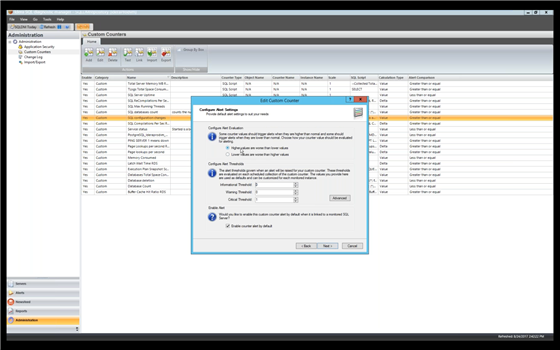
SQL Diagnostic Manager, by default, displays a wide variety of the most common performance metrics for SQL Server and the operating system. In addition to providing these common metrics, custom counters provide the ability to add additional performance metrics to the console. The metrics are used for historical trending, on-demand monitoring, and schedule refresh alerting. Add Windows system counters, SQL Server system counters from the “sysperfinfo” system table, a custom SQL script that returns a numerical value, and performance counters for virtual machines and host servers that are accessible through the host server.
4.2 Custom Dashboards
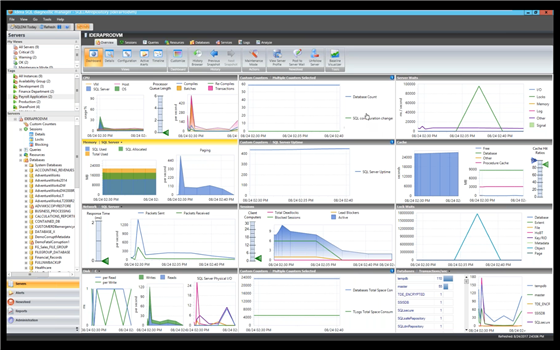
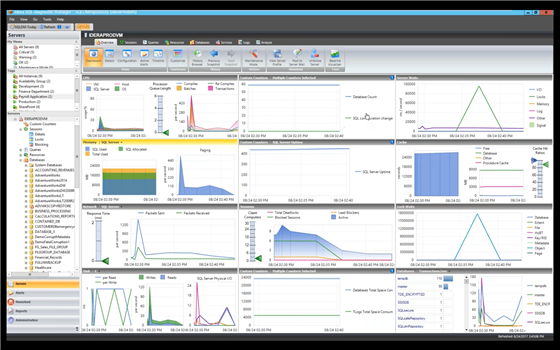
The Dashboard view is customizable per monitored SQL Server instance by selecting the panels that are important to view for that instance. Customize the Dashboard view for the selected SQL Server instance or as the default for all added SQL Server instances. When installing SQL Diagnostic Manager, it applies a default Dashboard view to all the SQL Server instances. The Panel Gallery allows altering the view to monitor the most critical metrics. When designing a Dashboard view, select the metric panels that display the current status and the best information for the selected SQL Server instance. Create multiple designs, create one design for each version of SQL Server, or create designs that show the essential panels to monitor when specific events trigger alerts. Save the design for other people in the environment to use as their Dashboard view.
5 Query Analysis
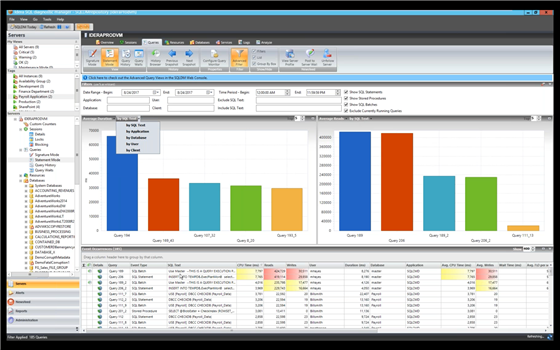
Query Monitor is a useful SQL Server tool to log and analyze queries. With Query Monitor, establish criteria for the queries to capture and filter those results to analyze the queries returned. Use the Query Monitor when diagnosing poor query performance on the SQL Server instance. Monitor queries if the SQL Server instance performance is weak, as a way to diagnose potential query issues.
5.1 Signature Mode
The Signature Mode view includes all active query information, automatically reduced to the signatures and grouped accordingly. The Signature Mode view is the place to start when investigating query performance. It broadly defines queries and trends with a less overwhelming amount of data and allows diagnosing a query in a general sense. After identifying a potential problem, view the Statement Mode view to see why a query is experiencing performance problems for a particular user. Subsequently, view the Query History to see how the query performs over time and the associated trends.
5.2 Statement Mode
The Statement Mode view includes queries that display as the Query Monitor Trace collects them. With the Statement Mode view, drill-down into a specific execution of a particular query. Whereas the Signature Mode view provides a filtered look at the queries, the Statement Mode view provides all of the detail that is needed to diagnose a specific problem with a query. After finding the problem query, track the query over time and view trends with the Query History mode.
5.3 Query History
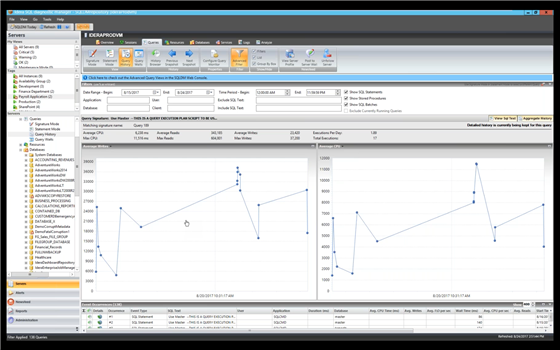
The Query History view tracks the performance of a query over time. To access the Query History view, select the relevant query on the Query Statement mode or Signature Mode view in the graph. Alternatively, access the Query History view by right-clicking a session on the Session Details view or a Statement on the Query Waits view and select Show Query History.
5.4 Query Waits
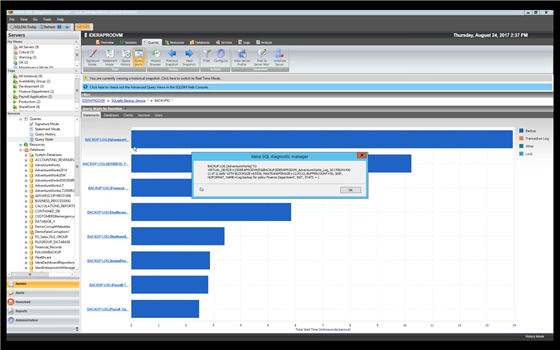
The Query Waits view displays the queries on the SQL Server instance with the most extended wait times. Display the query waits over time and investigate further based on statements, applications, databases, clients, sessions, and users. By analyzing these waits, better determine where the most significant bottlenecks are occurring and what changes could potentially have the most noticeable performance boost on the SQL Server instance. View query waits as the waits appear over time or by the duration of the wait, color-coded by the query. The chart includes the wait type categories backup, input/output, lock, memory, non-input/output page latch, non-page latch, transaction log, and other.
5.5 SQL Workload Analysis Add-on
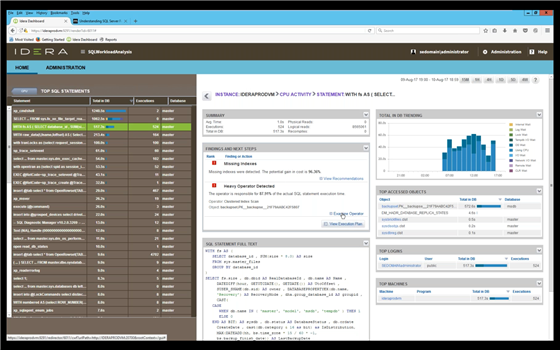
The SQL Workload Analysis add-on monitors SQL Server instances remotely and agentless from a dedicated framework machine. It has a web-based interface that is accessible from a web browser. It identifies, isolates, and resolves severe performance issues with specific SQL transactions or workloads in just a few mouse clicks. It provides a granular breakdown of SQL Server wait states with easy drill-down to isolate problems quickly. It delivers valuable real-time and historical data to help tune queries as well as actionable recommendations to improve performance. Its dashboard displays the trend of database activity and top utilizing SQL statements, logins, machines, and programs. Its dashboard makes it easy to identify problems and develop remedies across some situations.
Refer also to the video “Five Key Features of SQL Diagnostic Manager”.
Download a fully functioning 14-day trial of SQL Diagnostic Manager, request a one-on-one demonstration, or request a price quotation.
