SQL Diagnostic Manager has been around for a long time, and many of you have been using it for years. For today’s topic I thought it might be fun to go over 5 tiny features of SQLdm that you may have missed – either because they’re hidden, or because they were added with relatively little fanfare. All of these examples are accurate for SQL Diagnostic Manager 8.0 and 8.0.1.
Expanding and Collapsing The Ribbon and Server Tree
When the team was adding the Customizable Dashboard to SQL Diagnostic Manager, one of the discussions in our design meetings was “it sure would be nice if we had more room to add one more column.” So one of our enterprising developers added a couple of buttons to the system menu to allow us to do just that:
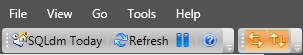 Those two little orange buttons allow users to show and hide the server tree on the left side of the screen and the ribbon at the top of the screen. This, combined with the customizable dashboard, allows users to add extra rows and columns and set up a view that can take advantage of all the screen real estate they may have on hand – perfect for NOC monitors and other places where you may have a view up for a long time without the need to interact with any of the commands.
Grouping Grids – Even Without a Group By Box
Throughout SQL Diagnostic Manager, the grid views used to display data support data grouping. This is often visible in the ribbon with the “show group by box” option.
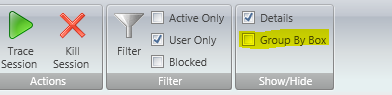
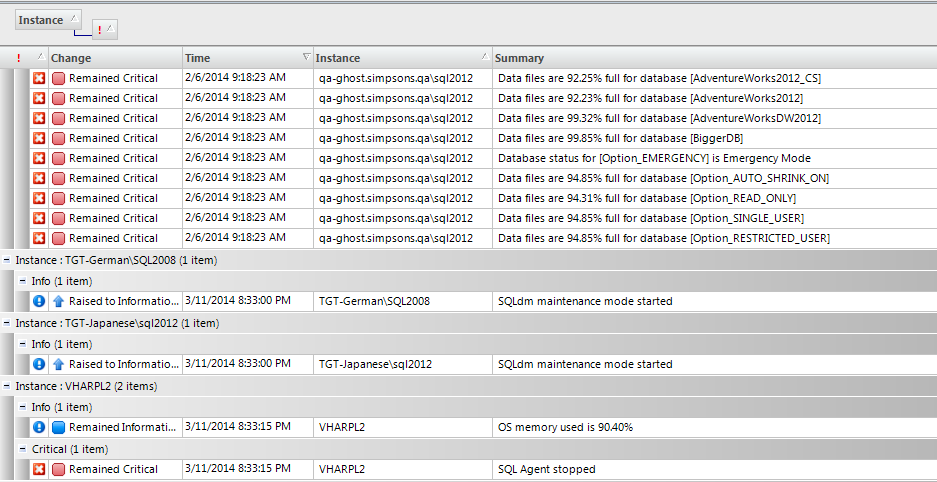
However, this ribbon option is not necessary and most grids in the product support this functionality, whether it is exposed explicitly or not. Just right click on the column header and choose either “Show Group by Box” or “Group By This Column.” One of the most important places that this comes into play is in the Alerts view, where you can gain a great deal of functionality by grouping by instance, severity, and/or time.
Export to Excel
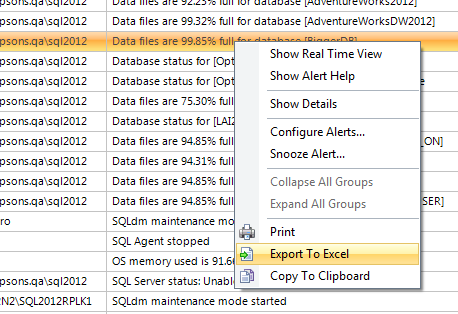
Speaking of grid functionality, if you right click in the data area of most grids, you can export the data directly to Excel. You can also print, copy to clipboard, and access a number of view-specific functions in most grids.
Put All Servers in Maintenance Mode / Snooze All Alerts
This one is a relatively recent addition. If you right click in the server tree on the name of a tag or at the All Servers root of the tree, you can enable, disable, or schedule maintenance mode across all servers. You can also snooze and resume alerts across your entire environment.
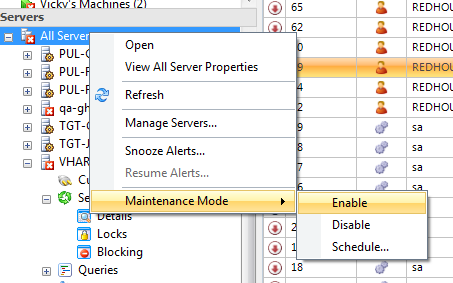
You can also right click in the uppermost part of the tree, clicking on “Critical Servers” or “Maintenance Mode” and setting your desired values across only those servers in the designated state.
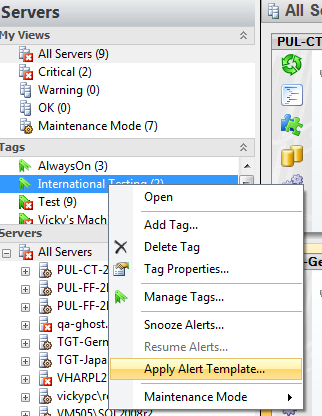
Apply an Alert Template to All Servers in a Tag
Similar to the above, you can right click on a tag in the server tree and apply an alert configuration template to all servers in that tag.
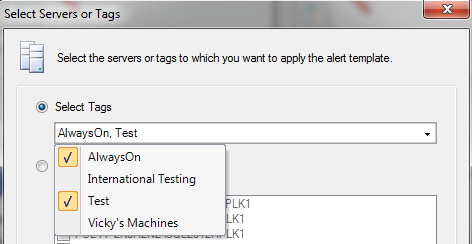
You can also do this through the Alert Configuration Templates screen itself. Go to Tools… Alert Configuration Templates, choose a template, and click Apply To…
So, there we have 5 quickie little features that hopefully might make your life a little easier.