To find the key points of how SQL Workload Analysis can help you, look for the ducks ![]() throughout this blog post!
throughout this blog post!
What Is SQL Workload Analysis?
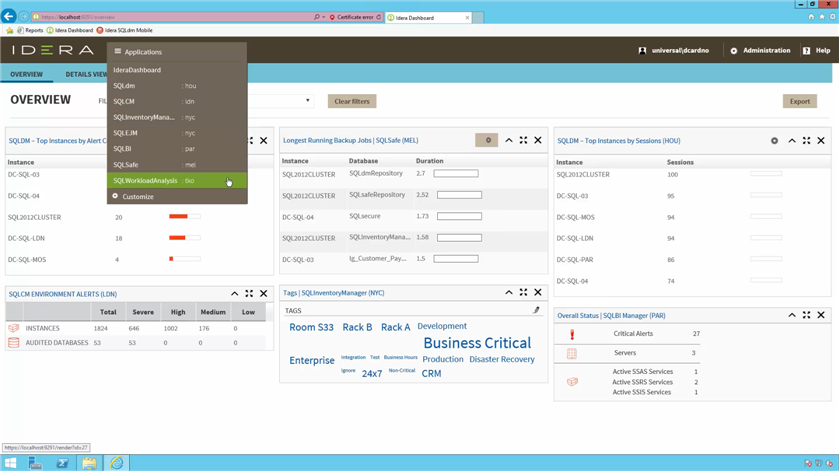
It is an add-on to SQL Diagnostic Manager and a component of the IDERA Dashboard. This dashboard is the central portal for several tools from IDERA. These tools include tools for security, backup, business intelligence, and inventory management.
Figure 1: In the IDERA Dashboard, view (for example) the top instances by alert count and by sessions for SQL Diagnostic Manager, the environment alerts for SQL Compliance Manager, the longest running backup jobs for SQL Safe Backup, the tags for SQL Inventory Manager, and the overall status for SQL BI Manager.
What Does SQL Workload Analysis Do?
Identify where SQL Server issues exist. Then, drill down into periods of latency. This way, correlate all of the contributing factors to establish the root cause. Immediately know what databases are processing, drill into SQL statements, and receive actionable advice.
Explore Top Monitored Instances
 With very few clicks access lots of relevant real-time data and insightful historical trends from frequent sampling.
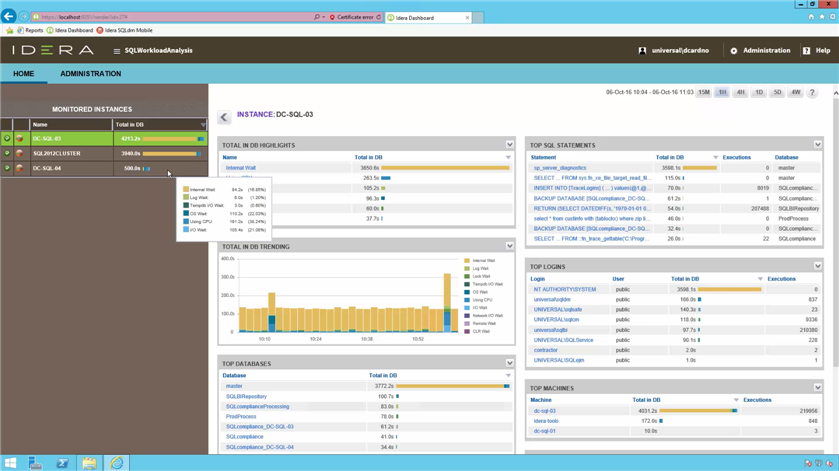
The web-based user interface presents a consolidated view of various key indicators of performance. By default, the unified view displays the collected data for the last day. Show longer or shorter periods by selecting the corresponding control buttons.
Figure 2: List the top monitored instances. For a selected monitored instance, see the top waits and their trends, the top databases, the top SQL statements, the top logins, and the top machines.
Focus on Problematic Occurrences
 With very few clicks drill-down to critical time intervals (for example, from 4 weeks to 5 minutes).
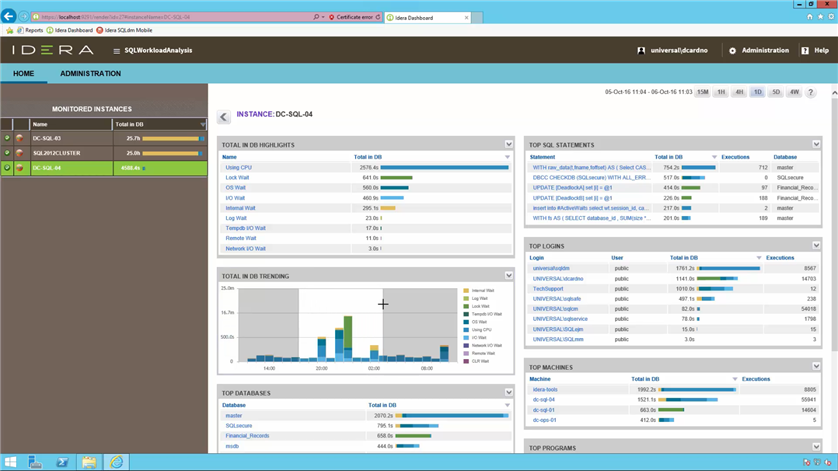
Drill into a more detailed perspective where there are noticeable spikes regarding the system performance. Drill in further by drawing a band around the problematic zone to reassess the contributing factors from that time.
Figure 3: Using any trend chart, zoom into a time interval by clicking and dragging a rectangle over the relevant sub-domain.
Explore Top Locked Objects
 With very few clicks drill-down from problems to their root cause.
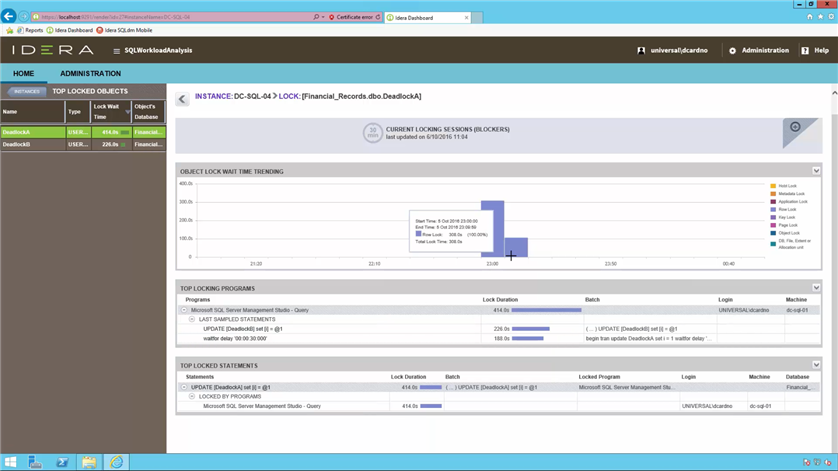
See the impact regarding queries, CPU, and lock waits. Select a hyperlink to identify the SQL statements, the corresponding users, and the application detail. This view also shows for how long the issue persisted for any given category.
Figure 4: List the top locked objects. For a selected locked object, display the trend for the wait times, the top locking programs, and the top locked statements.
Explore Top Logins
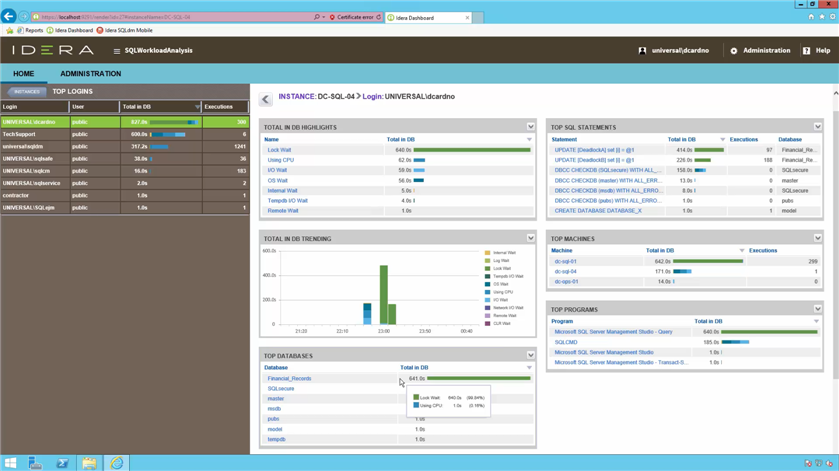
Back out of the previously selected period to show user-specific information. This information identifies where the user was accessing the system from and other associated SQL statements. Cycle through additional users in this view.
Figure 5: List the top logins. For a selected login, show the top waits and their trends, the top databases, the top SQL statements, the top machines, and the top programs.
Explore Top SQL Statements
 With very few clicks drill-down to actionable recommendations to improve query performance.
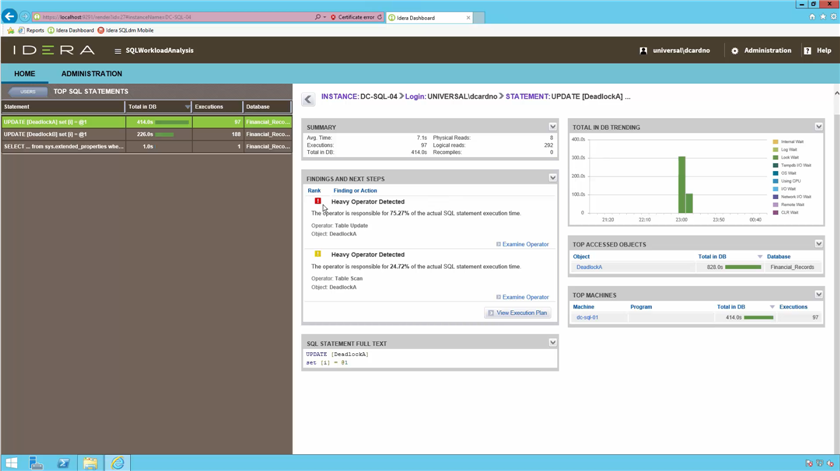
Select the top SQL statements to drill into more detailed query information. These details include what specifically are the heaviest operators per query and what percentage of the execution time they consume.
Figure 6: List the top SQL statements. For a selected SQL statement, view its performance summary, any findings (such as heavy operators) and next steps, the full text of the SQL statement, the trend of the waits, the top accessed objects, and the top machines.
 With very few clicks drill-down to query execution plans.
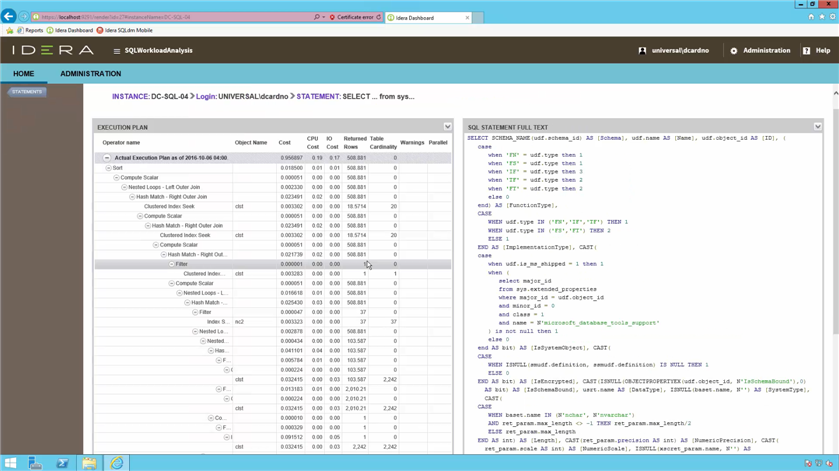
Break down the execution plan to show the specific components and the associated cost to performance. View heavily nested SQL statements with many factors contributing to the overall performance.
Figure 7: For a selected SQL statement, see its execution plan and its full text.
Explore Top Programs
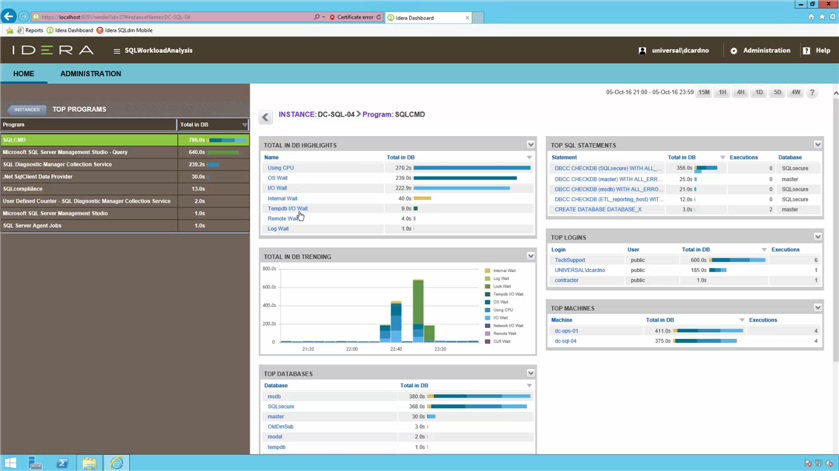
Pull the detail from the noisy applications into focus and drill into the impact that they had at that time. Consolidate all of the key performance indicators.
Figure 8: List the top programs. For a selected program, show the top waits and their trends, the top databases, the top SQL statements, the top logins, and the top machines.
Customize the Layout
From the top level, configure the components. Manipulate panels to highlight and focus on areas of concern. In the user interface, display prominently the items that matter most.
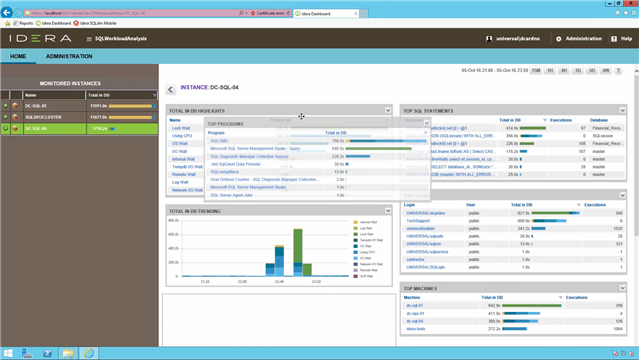
Figure 9: Customize any dashboard layout by moving, closing and opening each panel to display the most relevant information in the most convenient location.
Final Thoughts
 Effortlessly manage the performance of complex SQL Server environments.
With SQL Workload Analysis, apply continuous sampling to provide a real-time view of entire databases. Quickly drill down to isolate slow SQL statements, analyze execution plans, and see automated recommendations to tune problem statements. Improve application performance with built-in recommendations, and arrive at root cause fast with integrated operational and transactional diagnosis.
