Problem Background
A business-critical third-party application for Microsoft SQL Server configured the database with generic settings, including general indexes. Such generic parameters are likely going to lead to suboptimal performance and may even lead to poor performance. Use Precise to investigate the impact of such generic index on the performance of the application.
Investigation
Most database performance monitoring products show SQL activity. Precise also indicates busy tables. Precise ranks the most active tables in SQL Server and how SQL Server uses these tables.
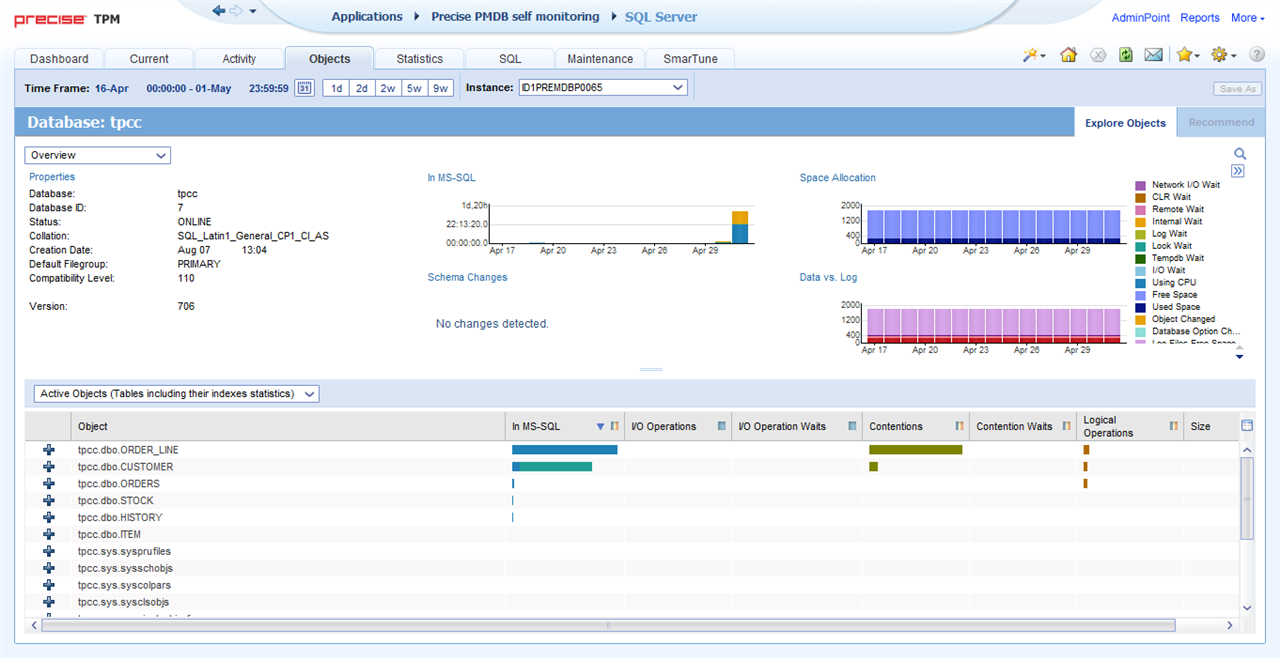
The ‘Overview’ pane’ at the top of the ‘Explore Objects’ tab of the “Objects” workspace for the problematic instance of SQL Server (Figure 1) shows that the SQL Server database spent some 1 hour of mostly using CPU and internal wait.
The ‘Active Objects (Tables including their indexes statistics)’ area at the bottom of the ‘Explore Objects’ tab displays the objects in the order of time spent in the SQL Server database. The data grid shows that the top table ‘ORDER_LINE’ is the busiest on the system by far. Its time on using CPU in the SQL Server database and its time for contentions are substantial. The second table ‘CUSTOMER’ suffers from significant time spent on lock wait in the SQL Server database. Since the top table ‘ORDER_LINE’ is vital to important business transactions, it warrants additional attention. There is a lot that a database administrator can do to improve the efficiency of processing. To determine how to improve access to the top table, select it to drill down into its details.
Figure 1: The ‘Explore Objects’ tab of the ‘Objects’ workspace for the problematic instance of SQL Server.
Precise correlates the top table to the SQL statements that access it. The SQL statements that ran on Monday will probably be similar to the SQL statements that will run on Tuesday. Etc. That is, in a business setting, data is often accessed in similar ways day to day. Consider reporting when the managers need to know what happened yesterday, last week, last month, last quarter, last year. The SQL statements will be similar while grouping growing durations of business activity. The similarity implies that a set of indexes exists that is well suited to the accessing the top table. For such a situation, Precise can provide helpful recommendations.
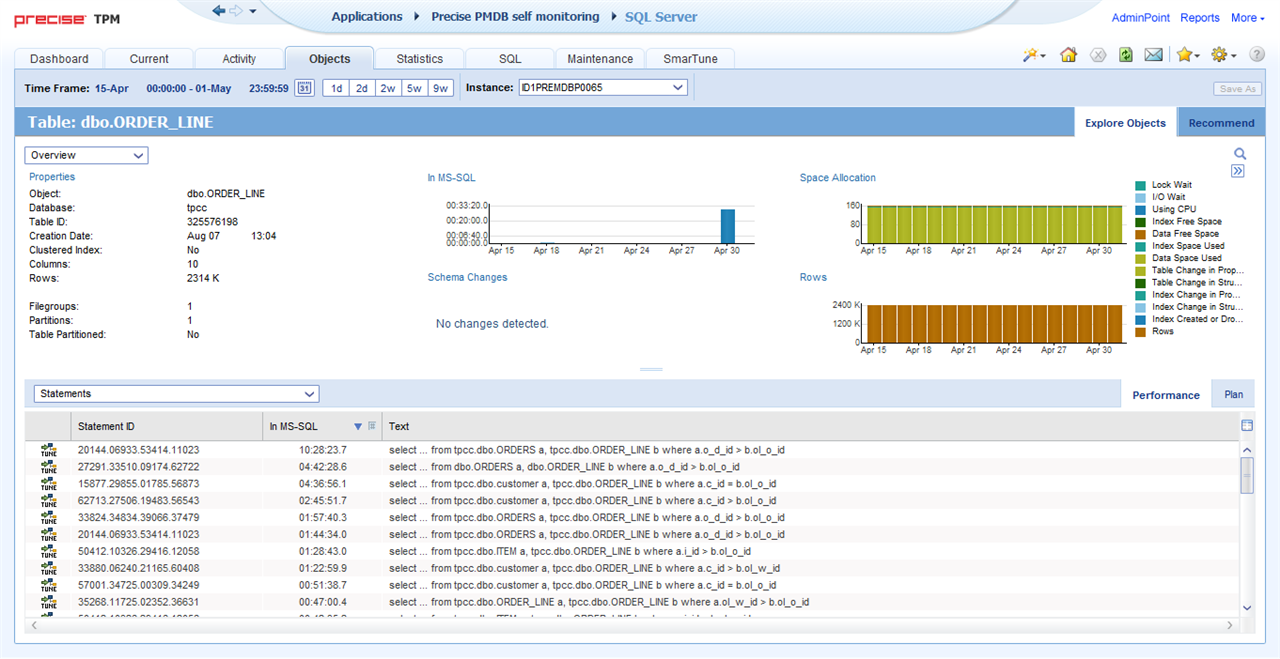
The ‘Overview’ area at the top of the ‘Explore Objects’ tab of the ‘Objects’ workspace for the top table (Figure 2) shows that the table spent some 30 minutes of using CPU.
The ‘Statements’ area at the bottom of the ‘Performance’ tab lists the SQL statements for the top table in the order of time spent in the SQL Server database. The top SQL statement identified by ‘20144‘ spent more than 10 hours in the SQL Server database. The data grid also shows that many of the top SQL statements are similar which is quite common for third-party business applications. These alike SQL statements imply that it may be possible to add indexes to the table that accelerate performance.
Select the ‘Recommend’ tab in the top right of the ‘Objects’ workspace to view recommendations for adding, modifying, and dropping indexes.
Figure 2: The ‘Explore Objects’ tab of the ‘Objects’ workspace for the top table.
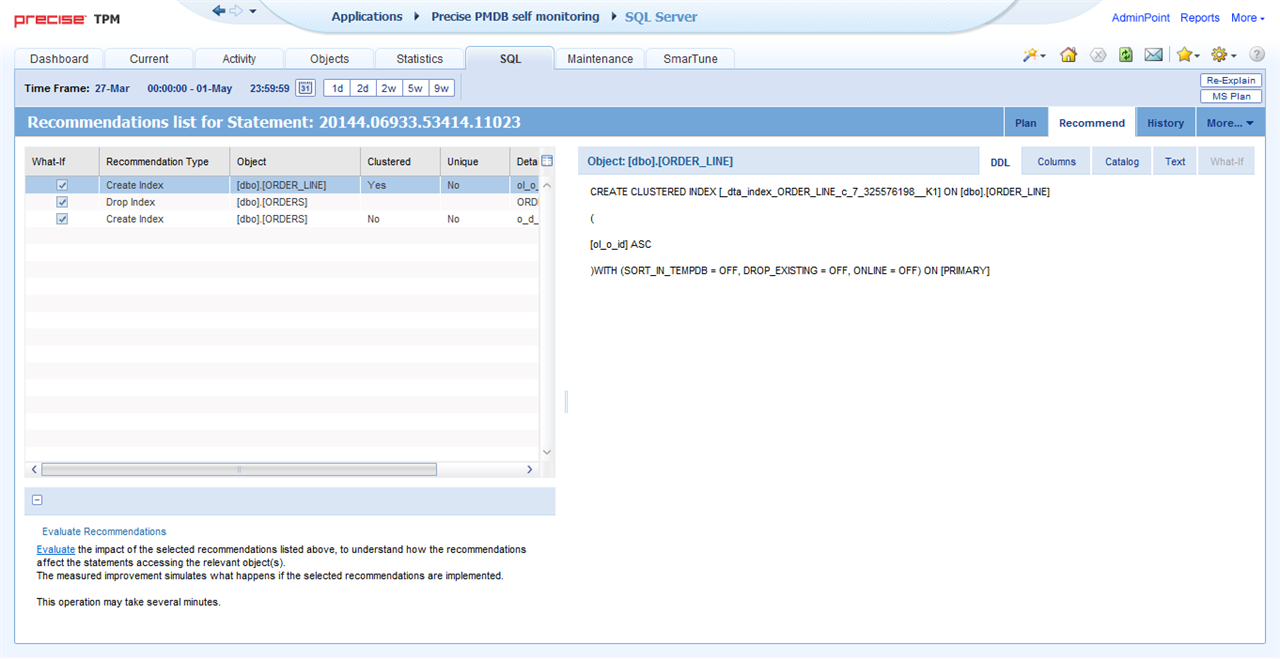
The data grid at the top left of the ‘Recommend’ tab of the ‘SQL’ workspace for the top SQL statement (Figure 3) displays the recommendations. The first row of the data grid refers to the recommendation ‘Create Index” for the top table ‘ORDER_LINE’ for an index that is clustered and not unique. The What-If modeling capability is available for this recommendation.
The ‘DDL’ subtab at the right side of the ‘Recommend’ tab displays the data definition language script for the recommended new index.
Below the data grid at the top left of the ‘Recommend’ tab, the ‘Evaluate Recommendations’ area offers to evaluate the impact of the selected recommendations list above to understand how the recommendations affect the statements accessing the relevant objects; the measured improvement simulates what happens when implementing the selected recommendations. Select the ‘Evaluate’ hyperlink to access the modeling functionality by displaying the ‘What-If’ subtab at the right side of the ‘Objects’ workspace.
Figure 3: The ‘Recommend’ tab of the ‘SQL’ workspace for the top SQL statement.
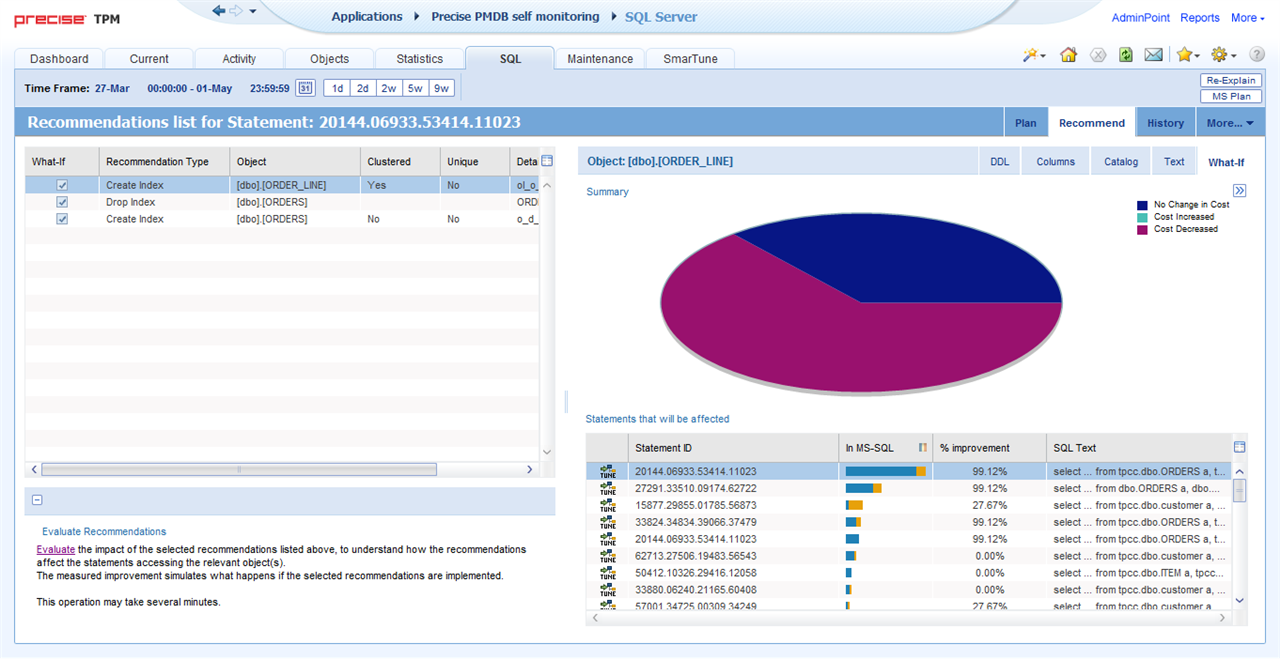
The ‘Summary’ area at the top of the ‘What-If’ subtab at the right side of the ‘Recommend’ tab of the ‘Objects’ workspace for the top SQL statement (Figure 4) displays a pie chart. The pie chart shows the cost of the recommended new indexes as displayed in the data grid with the recommendations on the left side of the ‘Objects’ workspace. The pie chart shows that the cost mainly increases, a fraction of the cost did not change, while no cost increased.
The ‘Statements that will be affected’ area at the bottom of the ‘What-If’ tab displays the expected improvement by all SQL statements that access the top table ‘ORDER_LINE’. The data grid lists the SQL statements in the order of their time spent in the SQL Server database. The top SQL statement identified by ‘20144’ can improve by some 99%. For the more than 10 hours of time spent on using CPU in the SQL Server database, this improvement corresponds to more than 10 hours that will have a significant impact on processing. The improvement will save money for Information Technology and allow business transactions to complete faster while consuming fewer resources.
Figure 4: The ‘What-If’ subtab of the ‘Recommend’ tab of the ‘SQL’ workspace for the top SQL statement.
Findings
It appears that the application spends the majority of the processing time in the SQL Server database. Accessing busy tables consumes resources.
Summary
Precise showed that the SQL Server database was very CPU intensive. Precise then narrowed down the performance problem to a specific database object and then to a particular SQL statement. Precise then provided recommendations and What-If Analysis for the suggestions. The analysis showed that the performance would improve significantly. Consequently, the maintenance and modifications of the configuration of the database allowed for more efficient and faster access to the SQL Server database.
For Precise for Databases, you may want to browse the product web pages, watch the overview video for Precise for SQL Server, read the datasheet, view TechValidate survey results for a Global 500 banking company, request a live demonstration, and request a price quotation.


