Executing resource-intensive SQL queries requires a significant amount of processor time, memory, and bandwidth, and storage. Resource-intensive SQL queries prevent other SQL queries from using these resources. This can eventually lead to blocking. Common causes of blocking are poor execution plans, lack of proper database indexes, poor application design, and misconfigured SQL Servers. Finding resource-intensive SQL queries is necessary for performance monitoring and tuning. Accurately identifying resource-intensive SQL queries is necessary to troubleshoot potential performance issues in early stages before they cause serious problems.
Monitor and diagnose the performance of SQL queries for Microsoft SQL Server with IDERA SQL Diagnostic Manager several different ways.
1 Signature Mode View (General Performance)
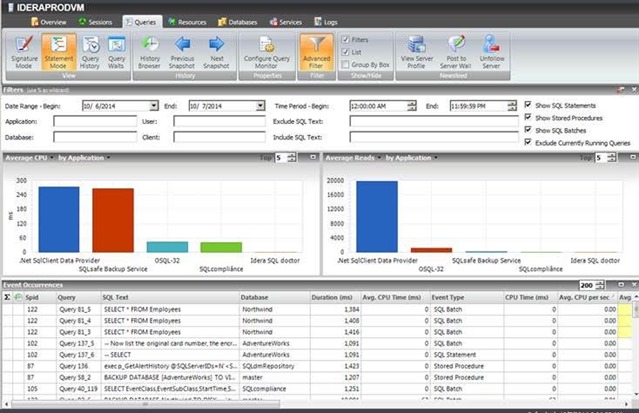
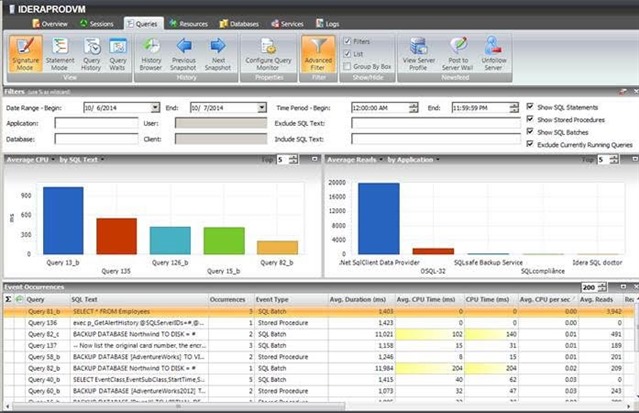
View individual SQL statements or view query signatures. Query signatures are groupings of SQL statements that match after stripping their literals. A query signature broadly defines queries and trends with a less overwhelming amount of data to diagnose a query in a general sense. After identifying a potential problem signature, drill into individual queries that make up the signature. Monitor average CPU, average reads, average writes, average duration, and the number of occurrences. Refer also to the documentation View the query monitor signature mode and Advanced query signature view.
2 Statement Mode View (Specific Performance)
View individual SQL statements or view query signatures. Query statements are presented exactly as the query monitor trace collects them. Query statements provide all of the detail needed to diagnose a specific problem with a query. After identifying a potential problem statement, drill into the Query Details view. Monitor individual CPU time, individual reads, individual writes, and specific execution duration, as well as user database and application. Refer also to the documentation View the query monitor statement mode and Advanced query statement view.
3 Query History View
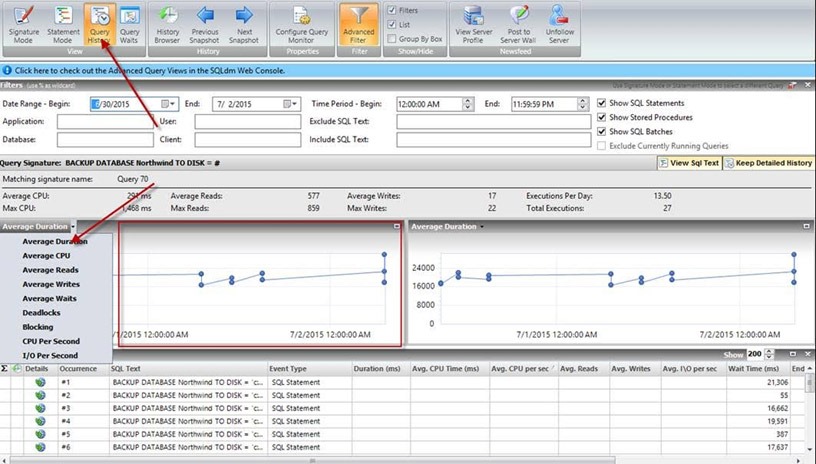
Measure the daily historical performance impact based on the number of occurrences throughout the day for every day. The history includes the duration, amount of CPU time each day, and the level of reads and writes. Understand historical trends for the selected query performance and how code changes may have improved performance into the future. Refer also to the documentation View the query history.
4 Query Waits View
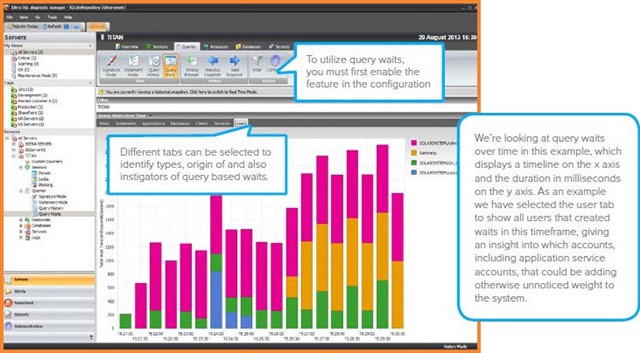
Analyze waits over time and by duration to locate the top bottlenecks and what changes may potentially have the biggest performance boost on the SQL Server instance. Display a dual graphical view of query wait statistics to see an impact analysis of waits historically and to perform a real-time assessment of existing query activity and associated waits. Use the history browser in conjunction with wait stats for a very granular level of root-cause analysis when identifying performance bottlenecks in the past. Refer also to the documentation View query waits and View your SQL Server query waits information.
5 Execution Plan
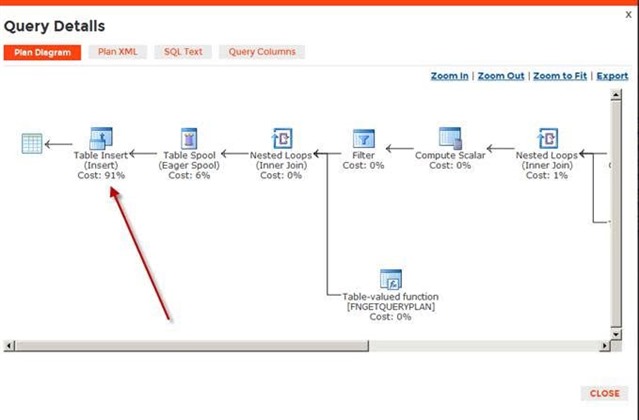
The execution plan assesses how queries perform and where to improve the code. The execution plan diagram displays the query execution plan (actual or estimated). The diagram shows the tree of operations that make up a query. This tree shows individual operation nodes and the pertaining graphical execution plan icon, along with basic information such as operator name and operation percentage of total cost. The execution plan also shows the referenced tables and columns to understand where a potential index adjustment may improve performance. Refer also to the documentation Query Details view.
6 Top Queries Report
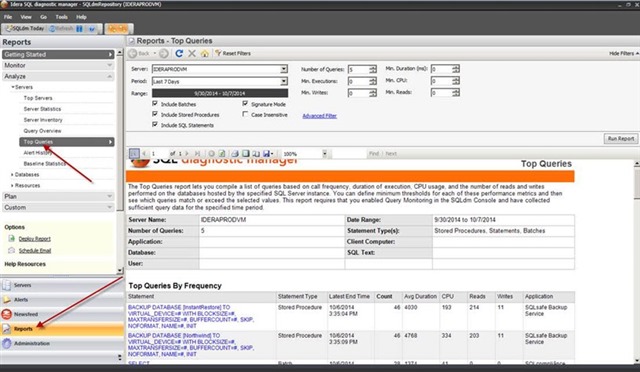
The Top Queries report compiles a list of queries based on call frequency, duration of execution, CPU usage, and the number of reads and writes performed on the databases hosted by the specified SQL Server instance. Define minimum thresholds for each of these performance metrics and then see which queries match or exceed the selected values. Report on the worst queries within the report interface. Apply some report filters such as filtering by user, database, application, hostname, and by different performance criteria (such as CPU, memory, reads, and writes). Refer also to the documentation Top Queries server analysis report.
7 Queries Tab Filtering
On each Query tab, the filtering capabilities provide an option for focus on specific queries relevant to the performance. Include and exclude specific applications, databases, users, clients, SQL text, and more via advanced filters. Refer also to the documentation View your SQL Server queries information.
8 Prescriptive Workload Analysis
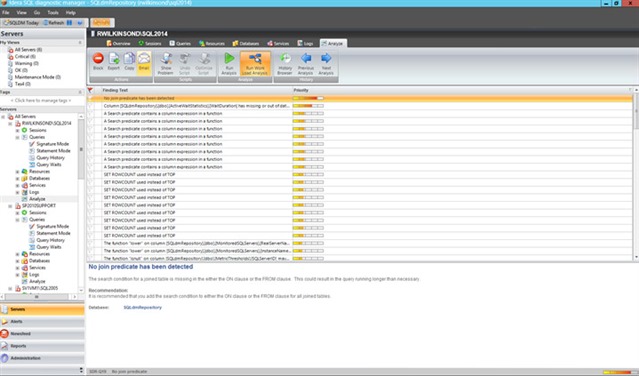
Run a prescriptive analysis on a specific SQL Server instance to identify and resolve SQL Server performance problems. The analysis engine scans the SQL Server configuration for potential problems and the health of the databases, resulting in a useful set of recommendations for improving performance. Prescriptive analysis targets some of the most common areas of SQL Server performance problems. Instead, workload analysis targets the performance categories for index optimization and query optimization. Workload analysis provides recommendations for these two categories that use a high amount of performance resources when running. Refer also to the documentation Run a workload analysis on your SQL Server
9 SQL Workload Analysis Add-On
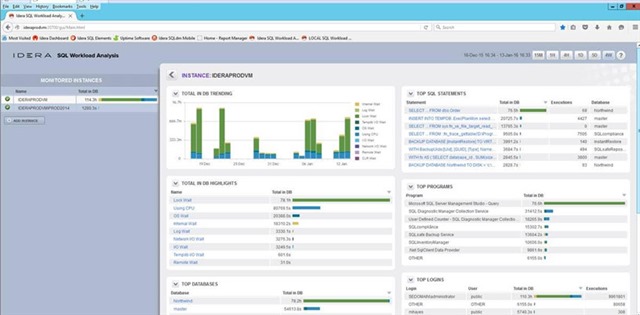
The SQL Workload Analysis add-on provides granular wait state monitoring, continuous SQL sampling, intuitive drill down to view top activity, query plan tuning and recommendations, lock and latch resolutions, and storage visibility and contention resolution. Identify, isolate, and resolve tough performance issues with specific SQL transactions or workloads in just a few mouse clicks. Refer also to the documentation Launch SQL Workload Analysis and Welcome to SQL Workload Analysis.
Please also refer
Download a fully functioning 14-day trial of SQL Diagnostic Manager, request a one-on-one demonstration, or request a price quotation.

