This is the first part of a three-part series of blog posts. Click here to view the second part.
Overview
SQL Diagnostic Manager for MySQL is an IDERA product that allows you to monitor MySQL and MariaDB databases. The product is a low-overhead, low-maintenance tool that is easy to install and easy to use. The product is robust and flexible and helps you pinpoint the servers, database, tables, and other activity in your environment that needs your attention. Some customers monitor up to 1,200 instances.
Architecture
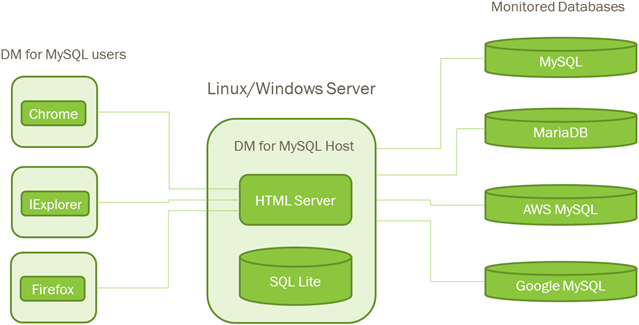
SQL Diagnostic Manager for MySQL is a Linux and Microsoft Windows application that runs on a server. The product is entirely self-contained. As such, the product does not require any client agents, web servers, and any other software installed. The product connects to your MySQL instances across the network and uses low-overhead and well-documented commands to gather information about the sessions, activity, and SQL statements that MySQL is executing, as well as server configuration and various logs.
The product stores the gathered information in an internal SQLite database. SQLite is a low-maintenance database that grows to roughly 3 GB to 5 GB of size per instance monitored. The size of SQLite depends on the amount of activity on the monitored server. The documentation details the schema. Moreover, both web-based and command-line utilities are available for SQLite when you choose to access the data directly. Most users, however, view pages, graphs, and other information through the web-based component of the product. Users connect to the host via any standard web browser.
Get Set Up
Download
SQL Diagnostic Manager for MySQL is available for a free, 14-day, fully-functional trial. The trial is limited to monitoring ten instances. Download the trial from https://www.idera.com/productssolutions/sql-diagnostic-manager-for-mysql/freetrialsubscriptionform.
Documentation
The documentation is extensive and well written. The documentation is an excellent resource for learning how to navigate and use the various pages in the Graphical User Interface (GUI).
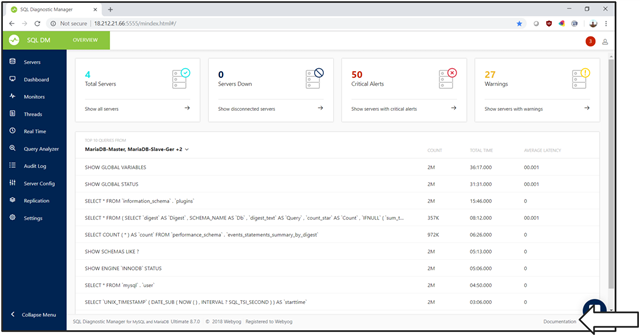
The documentation is available from within SQL Diagnostic Manager for MySQL from the Documentation link in the lower right.
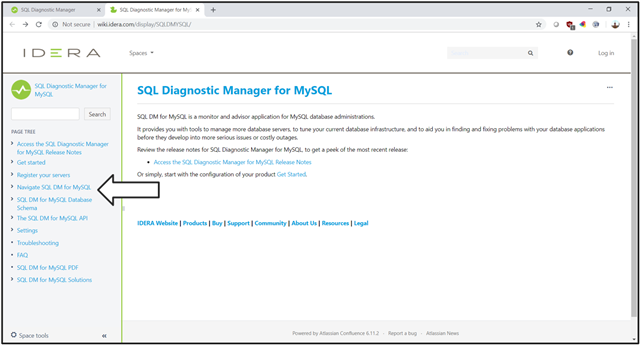
You can also access the documentation from any web browser at http://wiki.idera.com/display/SQLDMYSQL.
Expand the “Navigate SQL DM for MySQL” link.
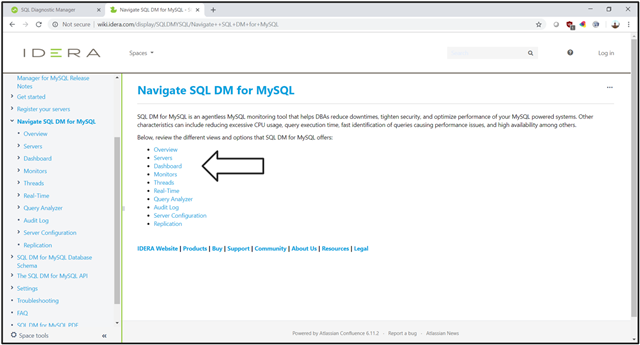
After expansion of the “Navigate SQL DM for MySQL” link, the documentation mimics the layout of the Graphical User Interface (GUI).
Install
The installation process for SQL Diagnostic Manager for MySQL on Microsoft Windows and Linux is straightforward, wizard-driven, and generally takes only a few minutes.
Microsoft Windows
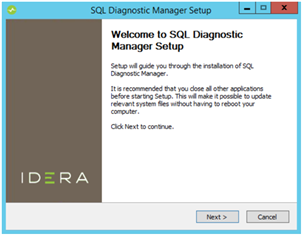
For Microsoft Windows, a series of Setup wizard screens drive you through the installation process. The product installs as a service in the Microsoft Windows operating system.
Linux
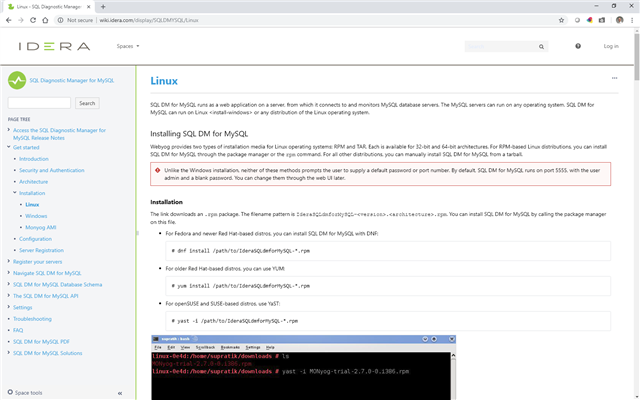
The product can also run on a Linux client. Installation is performed either as a package or as a Tarball. The Linux installation process which is also quite simple. The documentation describes in detail the Linux installation process at http://wiki.idera.com/display/SQLDMYSQL/Linux.
Install The product as an RPM Package Manager (RPM) package on Linux. The installation supports the RPM package managers DNF, yum, and YaST. Alternatively, install The product as Tarball on non-RPM Linux.
Access
Access SQL Diagnostic Manager for MySQL via a web browser. Merely enter the hostname and the installed port number. The detail port number is 5555. For example, enter http://localhost:5555.
Login
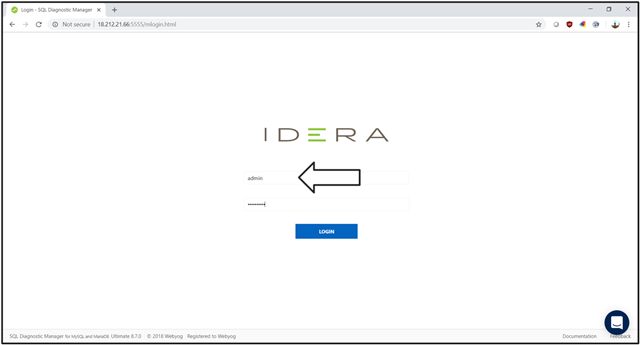
Gain access to the product by entering a username and password. The product encrypts and maintains the usernames and passwords.
Navigate General Layout
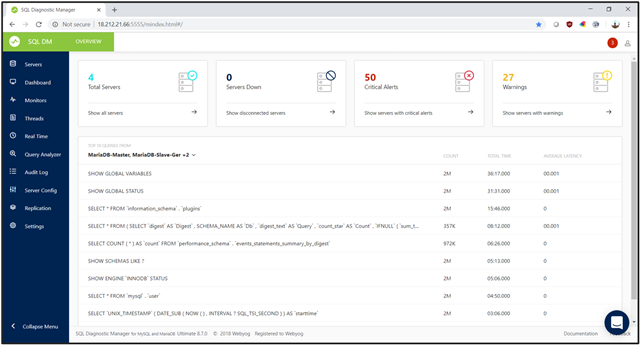
The general layout of SQL Diagnostic Manager for MySQL has menus available on the left and details for the selected menu item on the right. Dropdown list boxes are usually at the top of the page to allow the user to change the central area displays. The Overview page is available by selecting the logo in the upper left. You have the option of having either icons or descriptions for the main menu items on the left.
Manage Servers
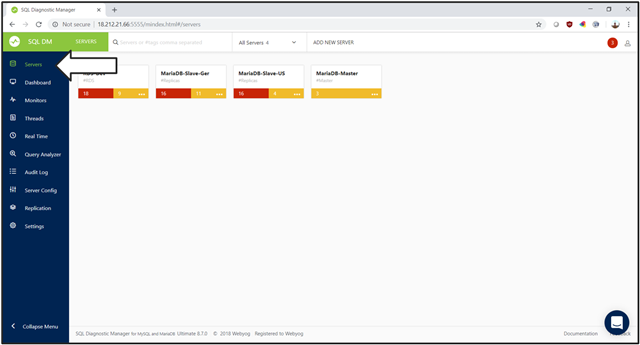
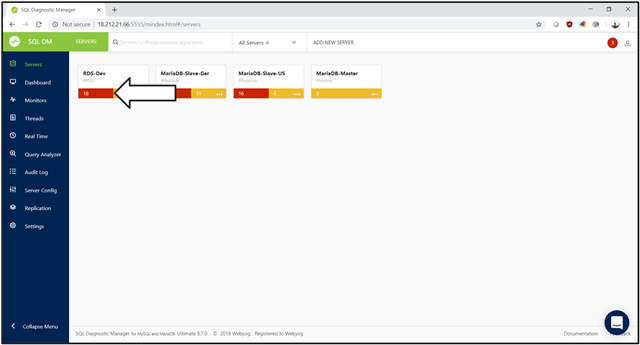
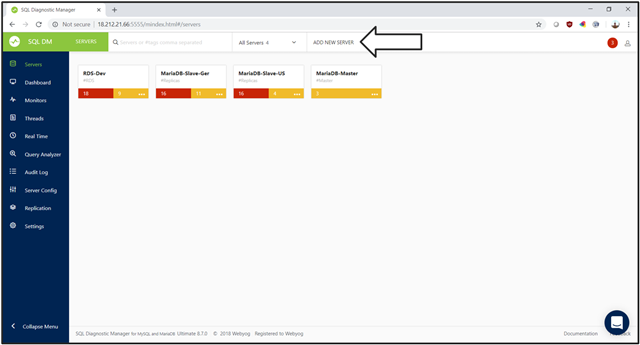
After installing, define servers. The SERVER page shows you the previously registered servers, as well as the number of critical and warning messages for each server.
Select the red and yellow highlights to get more information about what is causing the vital and warning behavior.
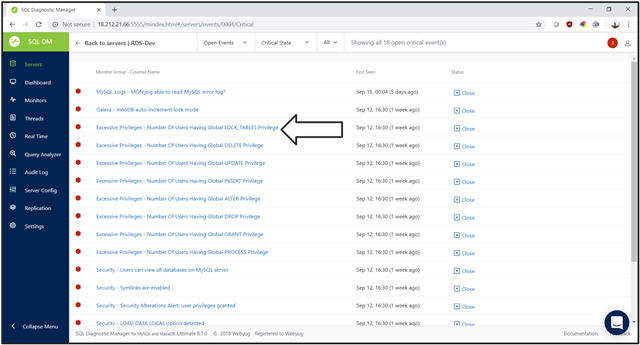
The single server view shows all of the essential messages for a single server. Select an individual notification to get more information.
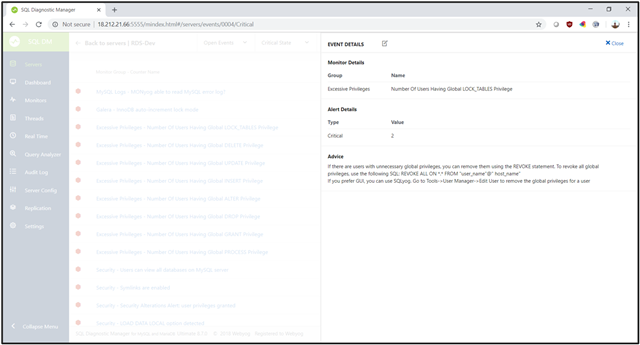
The EVENT DETAILS view shows what the condition is, what the last measurement for that condition was. The view also displays advice on how to handle the situation.
SQL Diagnostic Manager for MySQL has over 600 out-of-the-box monitors. These monitors help you to identify poor performance in your database and application, often before poor performance becomes critical.
Define New Servers
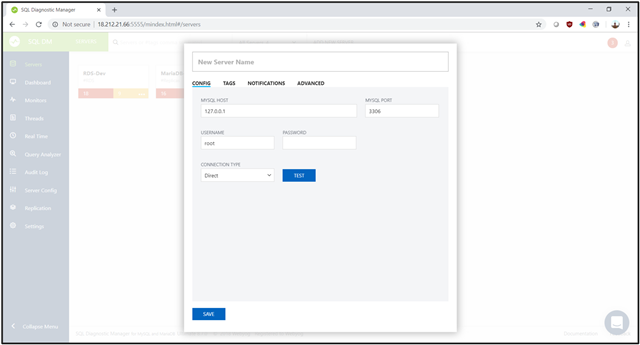
After the initial installation of SQL Diagnostic Manager for MySQL, the first task is to register database connections. Database connections require minimal information: host, port, and user. The MySQL or MariaDB database host can be either Microsoft Windows or Linux. The product supports encrypted communication via SSH tunneling, as well as Secure Socket Layer (SSL) socket connections for additional security. Adding new servers is performed by selecting the ADD NEW SERVER field.
Config
Enter the connection information in the CONFIG tab. The connection information includes the hostname, port number, connection information. The connection information also consists of the connection type, which is either direct, Secure Shell (SSH) tunnel, or Secure Sockets Layer (SSL) encryption.
Tag
The additional steps allow you to enter TAGS for this server. Tags are merely a free-form series of names and group names for this server. For example, the tag can be either PROD or QA. Alternatively, base the label on the product, geographic, and any other grouping that makes sense for organizing your MySQL instances.
Notifications
The NOTIFICATIONS tab specified the settings for sending notifications when alerts based on monitors occur.
Advanced
The ADVANCED tab allows you to turn data collectors on and off, change data retention times, and so on for either a single or more servers.
Edit Servers
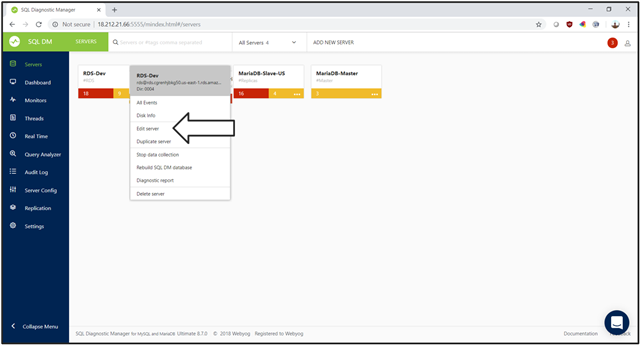
The SERVERS page can also be used to edit an existing server. Right select the ellipsis (…) next to each server and select Edit Server. Change the connection credentials, tags, and any other information related to that server.
This is the first part of a three-part series of blog posts. Click here to view the second part.
For SQL Diagnostic Manager for MySQL, view the product pages, browse the datasheet, read a case study, download the free trial, request a live product demonstration, request a price quotation, and purchase in the online store.
