This is the third part of a three-part series of blog posts. Read also the first part and second part.
Analyze Queries
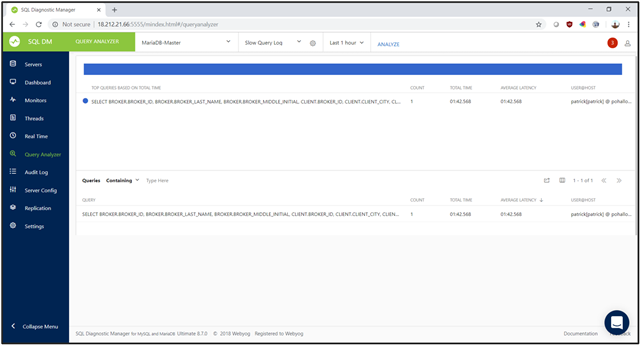
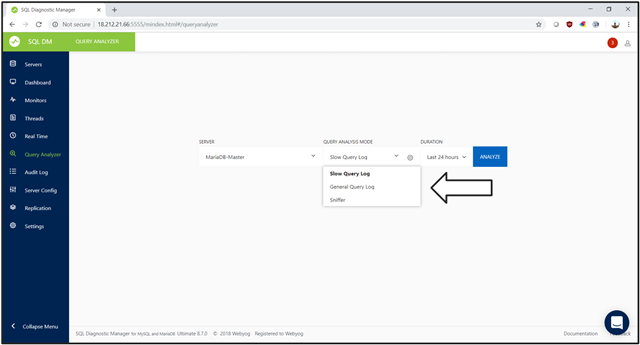
In addition to the real-time monitoring, SQL Diagnostic Manager for MySQL offers several different ways of identifying poorly performing SQL statements. MySQL maintains several logs, including the slow query log and general query log. When SQL statements meet specific criteria, MySQL writes these statements and other information in the logs, which can be in a file on disk, and in a table. Refer to the QUERY ANALYZER page.
Slow Query Log
The Slow Query Log is a feature of MySQL. By default, this log is turned off. However, when the log is on, MySQL logs statements that take longer than long_query_time seconds.
Here is the Slow Query Log displayed in SQL Diagnostic Manager for MySQL. You can see that the format is easy to read and quickly change the time frame as well as change which servers you are viewing. The view is much easier than reading through the raw logs.
General Query Log
MySQL uses the General Query Log for recording events, such as session connections and SQL query executions. Use this log to identify specific sessions and view a log of all SQL statements executed by that session. Displaying the General Query Log is similar to displaying the Slow Query Log as mentioned above.
Audit Log
MySQL records database events in the Audit Log. Such activities include startup, shutdown, connections, refused connections, SQL queries, and others. The Audit Log maintained by MySQL is challenging to read, as MySQL writes the log in a series of eXtensible Markup Language (XML) entries.
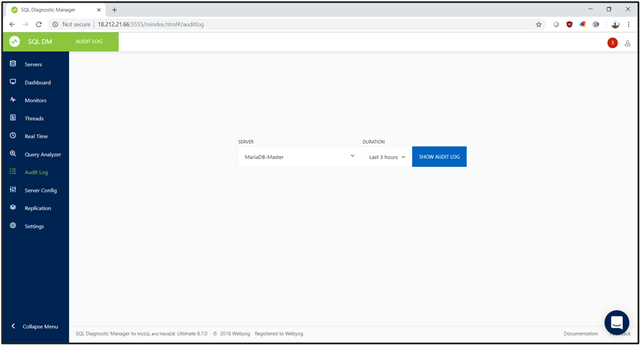
With SQL Diagnostic Manager for MySQL, in the ALERT LOG page, select the server name and a timeframe when the audit log is configured for your MySQL instance. The product scans the log and list all events (up to 10,000) within the specified time frame.
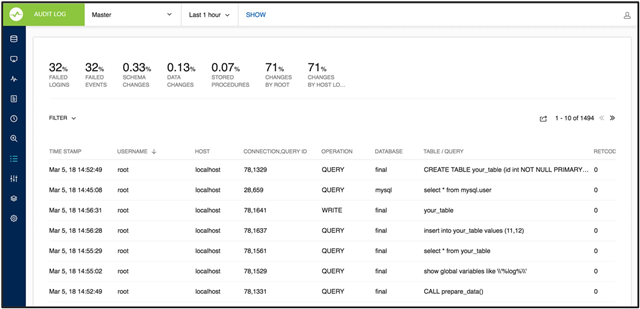
Quickly view the audit events as well as apply filters. Initially, you see a quick summary at the top of the page showing summary statistics and then each audit log entry in the bottom table. The filter allows you to focus on events related to a specific user, host, operation, database, and table. If you need to trace what a particular session was doing and what was updating a particular table, then view information about sessions and SQL related to that change. For that purpose, manipulate the timeframe and apply filters. This page allows you to see the Audit Log over a specified period. You can also filter on users and other criteria. As with the other logs, switching from server to server is straightforward.
Sniffer
Sniffer is a feature that is unique to SQL Diagnostic Manager for MySQL that is a more extensive logging function. The Sniffer gathers additional data beyond what these MySQL log files collect. Such information includes rows sent, temp tables created on disk and in memory, joins, sorts, index use, and other statistics that can be used to identify poorly performing SQL. Sniffer allows you to define additional criteria. When meeting these criteria, the product adds the SQL statement to the Sniffer pseudo-log.
Performance Schema on MySQL contains queries executed on the server along with other information. Such information includes the number of rows sent and examined, the number of temporary tables created on the disk, the number of temporary tables created in the memory, and the number of joins performed and the type of join. Such information also includes whether sorting occurred and the kind of sort, whether index used, and whether good index used. Additional criteria are user and host, minimum time, and queries starting with a specific text string.
Manage Server Configuration
Changes to the configuration of a MySQL database can affect performance. Also, changes in settings between a database and another can affect performance, such as during load tests.
The SERVER CONFIG page offers a comfortable and historical way of viewing your MySQL server configurations. As such, the SERVER CONFIG page can be used to validate that different servers have identical setups. The SERVER CONFIG page can also be used to view configuration changes over time to investigate performance changes
Compare
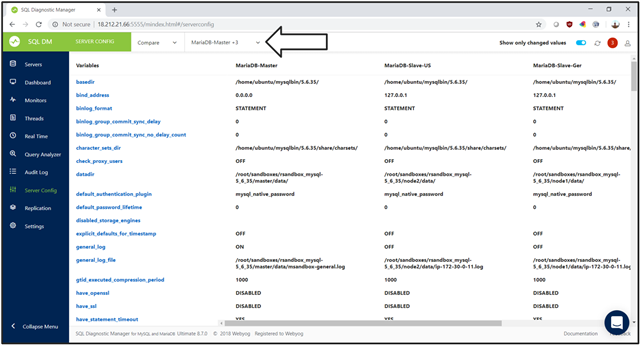
The SERVER CONFIG page allows you to compare settings between multiple servers, and to see configuration changes over time on a single server. The product samples and records the configuration of each MySQL on a regular basis. Use this sampling in two ways. First, compare either a single or more servers to see how they differ. The comparison is useful when you are trying to set up a cluster of identical servers to make sure that your load test server matched your production server.
Use tags and identify individual servers to compare. After selecting the servers and selecting Apply, view the configuration parameters that differ. Initially, you only see values that differ. See all configuration values by selecting the “Show only changed values” toggle in the upper right.
Track
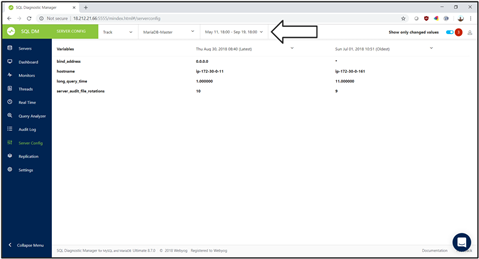
In addition to comparing changes, the product can show you how the configuration of an individual database has changed over time. View changes to a specific server over time. Use the archived configuration to report on when parameters changed, what they evolve from, and to what they changed. Changes in behavior in MySQL environments can often be traced back to changes in the MySQL configuration.
Select the Compare dropdown list box and change the selection to Track. After selecting the server and the timeframe, choose ANALYZE. The product has a historical database of all MySQL configuration values. This page shows how they have changed over time.
Monitor Replication
MySQL performs replication by replicating transactions and data changes on backup servers. When the masters fail, the backups are ready and up to date. A potential problem with replication is the speed with which the replicated transactions occur. Because of geographical distances, network speed, and network outages, it is possible for the replication servers to become out of synchronization with the active nodes.
SQL Diagnostic Manager for MySQL shows a graphic interpretation of the replication architecture of your MySQL environment. In a replication environment, there are active nodes and stand-by replication nodes. As activity changes data and objects in the active node, the replication servers duplicate that activity. When the active node fails, the replication servers become active and continue processing database requests from users.
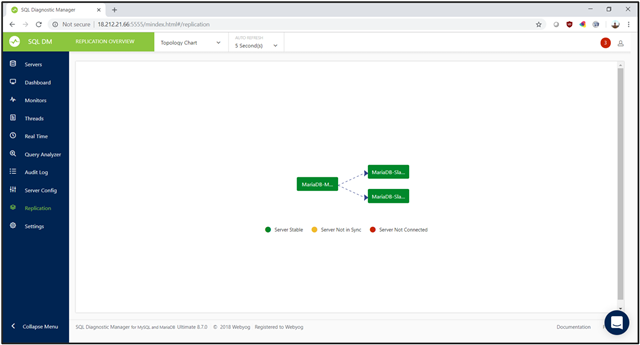
The REPLICATION OVERVIEW page gives a graphical and tabular view on the currency of your replication environment. This page, which refreshes, warns you when the backup servers lose synchronization with the primary server.
The initial graph, Topology Chart, shows a graphical image of the architecture of the replication nodes, as well as color coding showing the health of the individual nodes. This graphical chart can automatically refresh and can be displayed on a wall and near a team of database administrators to provide an immediate view on the health of the servers. You can also display the information in a tabular form.
Configure Settings
Perform all of the administration of SQL Diagnostic Manager for MySQL through the SETTINGS page. Use the SETTING page to manage users and roles. Setting up interfaces to other tools is also performed through the Settings page.
Communication
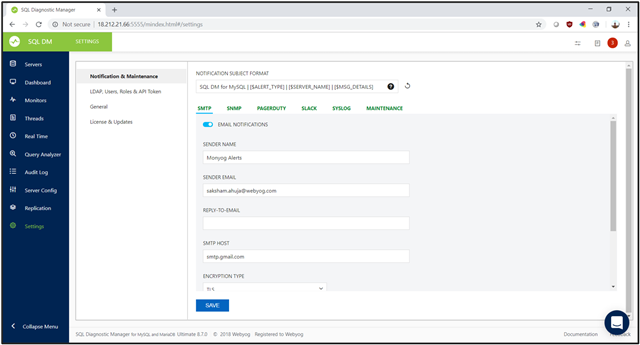
On the first page, you specify the product information on how the product communicates with the outside world. Specify settings for Simple Mail Transfer Protocol (SMTP), Simple Network Management Protocol (SNMP), PagerDuty, Slack, Syslog, and maintance.
Users and Roles
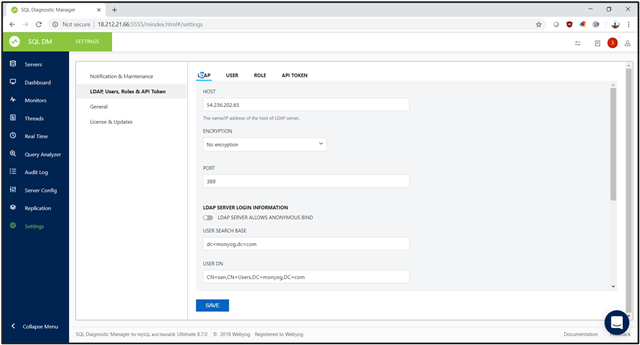
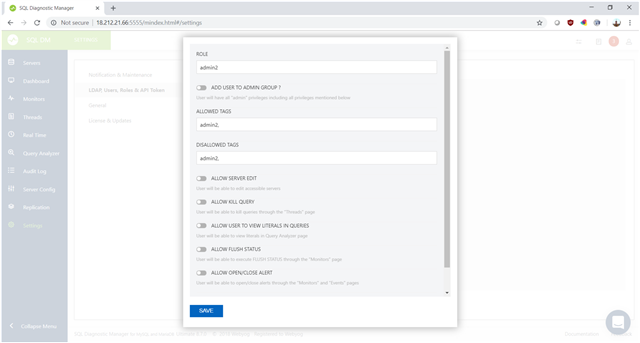
Import users from Lightweight Directory Access Protocol (LDAP) and assign roles to them.
In general, users are administrative users and regular users. Administrative users can change settings, while regular users cannot. You do have more control, though, in that you can use the ALLOWED TAGS and DISALLOWED TAGS to allow specific roles to either view and not view data from groups of servers. A few functions have toggle switches, including ALLOW KILL QUERY.
Supported Databases
SQL Diagnostic Manager for MySQL supports various implementations of the MySQL database. As such, the product supports Oracle MySQL Enterprise MySQL Server, MySQL Community Server, MariaDB, Percona Server for MySQL, Galera Cluster for MySQL, and MariaDB Galera Cluster. In the cloud, the product supports Amazon RDS for MySQL, Amazon RDS for MariaDB, Amazon RDS for Amazon Aurora, Google Cloud SQL for MySQL, and Oracle MySQL Cloud Service.
Summary
SQL Diagnostic Manager for MySQL is a low-overhead, low-cost solution to provide you visibility into your MySQL environment, whether the environment consists of either a single server or a thousand servers. The product is agentless and self-contained. Get the product up and running in generally just a few minutes. The product is available for a two-week free trial from https://www.idera.com/productssolutions/sql-diagnostic-manager-for-mysql/freetrialsubscriptionform. Extensive documentation is available at http://wiki.idera.com/display/SQLDMYSQL.
This is the third part of a three-part series of blog posts. Read also the first part and second part.
For SQL Diagnostic Manager for MySQL, view the product pages, browse the datasheet, read a case study, download the free trial, request a live product demonstration, request a price quotation, and purchase in the online store.
