Introduction
Microsoft PowerShell is an automation platform and scripting language for Windows and Windows Server that allows you to simplify the management of your systems. Unlike other text-based shells, PowerShell harnesses the power of the .NET Framework. PowerShell also provides rich objects and an extensive set of built-in functionality for taking control of your Windows environments.
Combine PowerShell and Uptime Infrastructure Monitor to automate and monitor Active Directory, servers, databases, Exchange, Windows, SharePoint, storage, System Center, networking, Office 365, Office, Windows Azure, applications, hardware, Remote Desktop Services, logs, printing, security, Group Policy, Windows Update, Lync, other directory services, Internet, local account management, backup and system restore, messaging and communication, multimedia, Project Server, etc.
Automatically react to problems detected by service monitors that run PowerShell scripts. Alert, escalate and recover by executing PowerShell scripts. Connect existing PowerShell scripts to Uptime Infrastructure Monitor to automate their execution. Customize and extend Uptime Infrastructure Monitor by utilizing the vast power of PowerShell scripts. Avoid writing certain PowerShell scripts by using the flexible yet simple environment of Uptime Infrastructure Monitor.
Examples of such remote actions include: administer Active Directory objects and user accounts; control Windows Update to check, download, install, and remove updates; install, repair, update, and uninstall programs and Windows Store apps; download and install prerequisites for software installations and upgrades; handle software product keys; generate system environment reports (for Windows, Exchange, SharePoint, Project Server, etc.); retrieve file versions; manage file system security via the access control list; create Windows shares; clean up file storage; and handle waiting print queues.
Combining PowerShell and Uptime Infrastructure Monitor
One of the major features of PowerShell is that it treats everything as an object instead of as files or text like many traditional scripting languages (for example, Bash). Also, Bash cannot edit the Windows Registry, cannot access Windows Management Instrumentation (WMI), cannot manage Exchange or Azure, etc. PowerShell has the power of expressing complex operations using the pipe mechanism that can result in fewer lines of code. Anyhow, the object-oriented approach of PowerShell means that it also handles its output differently than the conventional standard out and standard in conventions. For Uptime Infrastructure Monitor, this means that a slightly different approach is needed when triggering PowerShell scripts as a Custom Service Monitor or an Action Profile, as well as when using PowerShell scripts as custom commands via a Windows Agent.
Additionally, PowerShell handles whitespace characters and paths differently than the Windows Command Prompt. PowerShell can output objects or strings. When outputting string, ensure to encapsulate white space characters within Windows paths. Alternatively, to call a script from a path that contains whitespace characters, preceding each whitespace character with the escape character grave accent (`).
Finally, PowerShell (in contrast to traditional scripting languages) employs an Execution Policy that let you determine the conditions under which Windows PowerShell loads configuration files and runs scripts. Review the current setting by running the "Get-ExecutionPolicy" cmdlet on the executing Windows platform. Then, determine the appropriate setting and the level of risk to avoid running malicious scripts by reviewing Execution Policy.
For details concerning creating custom service monitors in Uptime Infrastructure Monitor, refer to Creating Custom Service Monitors.
Monitoring Station Side
The monitoring station needs to be running on a Windows operating system to leverage PowerShell scripts with Uptime Infrastructure Monitor.
To set up a PowerShell script for use with Uptime Infrastructure Monitor:
- Create a simple wrapper script in a batch file.
For example:myPowerShell.bat:@ECHO OFFPowerShell.exe -NoProfile -Command "& 'C:\uptime-scripts\backlog-monitor.ps1' " <NUL - Use the path to the batch file in the various "Script Name" fields within Uptime Infrastructure Monitor's custom monitors or as part of Alert and Action Profiles just like any other script.
@ECHO OFF: Turn the command-echoing feature off.-NoProfile: Do not load the Windows PowerShell profile.-Command: Execute the following PowerShell command.C:\uptime-scripts\backlog-monitor.ps1: Replace this example path with the path to the relevant PowerShell script.<NUL: Get the command input from the Null device. That is, instruct the Java virtual machine of Uptime Infrastructure Monitor to stop waiting for more output from the PowerShell script and to return the output to Uptime Infrastructure Monitor.
Agent Side
To set up a PowerShell script as a custom command for the Windows agent:
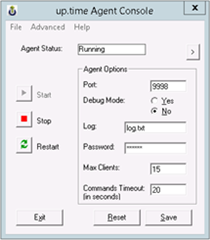
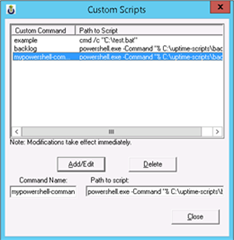
- In the “up.time Agent Console” dialog, select from the main menu the entry “Advanced > Custom Scripts” to display the “Custom Scripts” dialog.
- In the "Custom Scripts" dialog, provide the PowerShell.exe command directly in the "Path to Script" column.
For example:
In the "Custom Scripts" dialog, for the "Custom Command" text field enter "mypowershell-com" and for the "Path to Script" text field enter:powershell.exe -Command "& C:\uptime-scripts\backlog-monitor.ps1 - In the "up.time Agent Console" dialog, in the "Agent Options" panel, enter a "Password":
- Use the Custom Remote Monitor plugin or the Custom Remote Integer plugin to set up a service monitor to run the script.
Alert Profile and Action Profile Variables
To access alert profile and action profile variables of Uptime Infrastructure Monitor in PowerShell scripts, use PowerShell’s "Get-ChildItem Env" cmdlet. For a list of such variables, refer to Alert Profile and Action Profile Variables in the product documentation of Uptime Infrastructure Monitor.
For example (from the MS Exchange 2013 No Agent example):
$UPT_USERNAME = Get-ChildItem Env:UPTIME_USERNAME | select -expand value;$UPT_PASSWORD = Get-ChildItem Env:UPTIME_PASSWORD | select -expand value;$UPT_HOSTNAME = Get-ChildItem Env:UPTIME_HOSTNAME | select -expand value;$UPT_AUTHENTICATE = Get-ChildItem Env:UPTIME_AUTHENTICATE | select -expand value;
To pass variables directly to a wrapper batch file when calling PowerShell from an action profile, process the parameters in the beginning of the PowerShell file. For example (from the Spoken Alert example):
Param([string]$computer, [string]$gender, [string]$rate, [string]$texttospeak)
The parameters are processed in the order in which they are present on the command line. For example (from the Spoken Alert example):
C:\Windows\SysWOW64\WindowsPowerShell\v1.0\powershell.exe -ExecutionPolicy Bypass -file C:\uptime\scripts\speakalert.ps1 172.20.70.84 female 1 "The service %UPTIME_SERVICENAME% has entered the state %UPTIME_SERVICESTATE% for the duration of %UPTIME_DURATION%. Its host %UPTIME_HOSTNAME% has the status %UPTIME_HOSTSTATE%."
More Information
For examples of PowerShell monitors in Uptime Infrastructure Monitoring, refer to Custom WMI Object Monitor, Hipchat Alert, Spoken Alert, and MS Exchange 2013 No Agent.
For additional information, refer to the product documentation for Uptime Infrastructure Monitor, the Community Forum for Uptime Infrastructure Monitor, and customer product support.


