Problem:
Monitoring a traditional Microsoft SQL Server cluster, one that typically has 1 active and 1 passive node, is a challenge because at any point the services, storage, and SQL Server’s engine can be running on either (or any!) node at any time. Typically we have a “preferred node” however that we like SQL to run on, though we may have failovers from time to time, either manually for maintenance purposes or unexpected events. Because of this uncertainty, and because we know services only run on one node at a time, monitoring both (or all) nodes in the cluster always yields some items in an alert state.
Solution:
In any Windows Failover cluster, SQL or otherwise, you have a cluster DNS name that follows along with the current active node. This name is for the management of the cluster and connecting to this DNS name ensures you (ideally) will always be connecting to SOMETHING. IE: we don’t need to know or guess which node is available. Naturally, with Uptime, we are aware what servers are up or down, but this “virtual name” provides us a degree of convenience. First let’s understand what Uptime expects with monitoring any host.
In a virtualized environment, aside from the hostname (DNS) we have an IP address (absolute) as well as a system name (absolute server property) and a domain name (if it is joined to a domain). If you’re in a virtualized environment (likely) you also have a VMWARE or Hyper-V UUID. This unique identifier is also critical to Uptime as that is how we consider a server to be unique from the others. If you clone a VM, or detach and reattach a VM, the UUID changes. It can also be changed manually. This change tells Uptime that a new server exists. Uptime cares about most of these items but there are some differences.
Because of this, in a Virtualized server environment, simply adding the cluster’s “virtual name” as an agentless WMI element will not suffice. WMI exposes the complete UUID, for example “4239eef3-ce1f-ebd2-a2eb-c367de4aea7f”. Just as it is seen in a VM guest element with no hooks into WMI at all. Agents however expose the UUID in a different fashion, and in fact, because the “virtual name” doesn’t exist at all in VMWare, only in DNS, we can get away with adding the “virtual name” as an agent bound element. FYI, an agent exposes this same UUID as “a2 eb c3 67 de 4a ea 7f”.
Now let’s add another layer of complexity. Microsoft SQL Server Always-On Availability Groups (quite the mouthful, I will call them AA/AG from now on!) In this setup you have a “traditional” failover cluster except SQL Server gets installed as usual, and the only things that “fails over” as part of the AA/AG (typically / generically speaking) is the cluster virtual name, and the DNS name to IP resolution of the availability group itself and some internal bits in MS-SQL that defines what node is the primary read / write node. The main difference in an AA/AG is that SQL Server is completely active on both (or more) nodes. This allows you to do a lot more and also have near instant failover with likely zero data loss. We can have a read-only secondary replica for reporting purposes or backups for instance, and we can run normal, non-failover databases on either node totally independent from the failover enabled databases. So, instead of “wasting a server” when it’s not failed over as active, you can take advantage of it.
Ok, story is over. Here is how to make this work.
- Make sure all nodes in the failover cluster (or AA/AG) are added into uptime as WMI elements. It is okay if you’ve added them via vCenter / ESX discovery as well, we just need to make sure WMI is pulling data from them too.
- Make sure you have the latest agents installed on all the nodes as well and that they are running. We are not including the Uptime agent in any of the failover regimes, they should be left to run independent.
- Add the cluster “virtual name” into Uptime as an Agent system from Infrastructure > add system / network device. Using the virtual name as it appears in DNS. If the nodes are “SQL-NODE1” and “SQL-NODE2”, this would be something like “SQL-CLUSTER”.
At this point we have at least 3 servers added to Uptime. Next we need to monitor SQL. There are a number of ways of provisioning service monitors in Uptime. Slight differences exist for “traditional” SQL Cluster vs. AA/AGs.
For a traditional failover SQL cluster:
- Ensure the usual performance monitors exist on both nodes like performance check (watching cpu, mem, disk, etc) and file system capacity monitor to check C: to ensure it doesn’t run out of space. Because the disks fail over with the active node, your other drives will just “disappear” when the node is passive. That makes alerting on them difficult! So just focus on C: on these individual nodes, and optionally any other drive that doesn’t fail with the cluster.
- You may choose to monitor the MSSQLSERVER service on both nodes or you may not. If you DO, know that one will always be down and depending on criteria, you’ll get a warning or critical on that node because of this. I’d say if you do this, I would only associate an alert profile in a critical condition for the preferred active node, and potentially an alert for OK status on the normally passive node… Sounds weird right? Well, when failover occurs you can get two emails, one when the service you want running fails, and another when the one you don’t starts up… But wait there’s a better way! (I still like doing this though, but that’s me…)
- For the virtual hostname we added, this shall be where we monitor SQL Server itself. We’re going to want to create a few service monitors here.
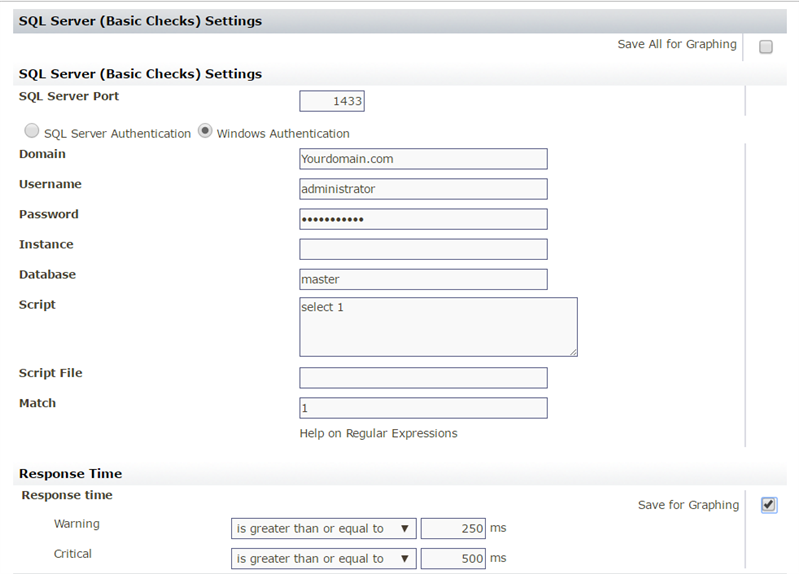
- SQL Server Basic Checks – We’ll want to do something very simple here. I usually use the MASTER database and for the query, do SELECT 1; In the expected output I put 1. See below (this is actually the default setting for this monitor)
This lets us know that SQL is working and the response time we get tells us roughly how quickly it responds. You may need to adjust your response time settings a bit, but I like to keep them fairly low and save them so I can graph it later.
- SQL Server Query Monitor – This one you’ll need to add from “the grid”. When you go to add a service monitor click the “want more” link in the top right hand corner:
click the green install button if you don’t already have it installed (I do) then when it finishes successfully (watch the message!) you can hit back and add it.
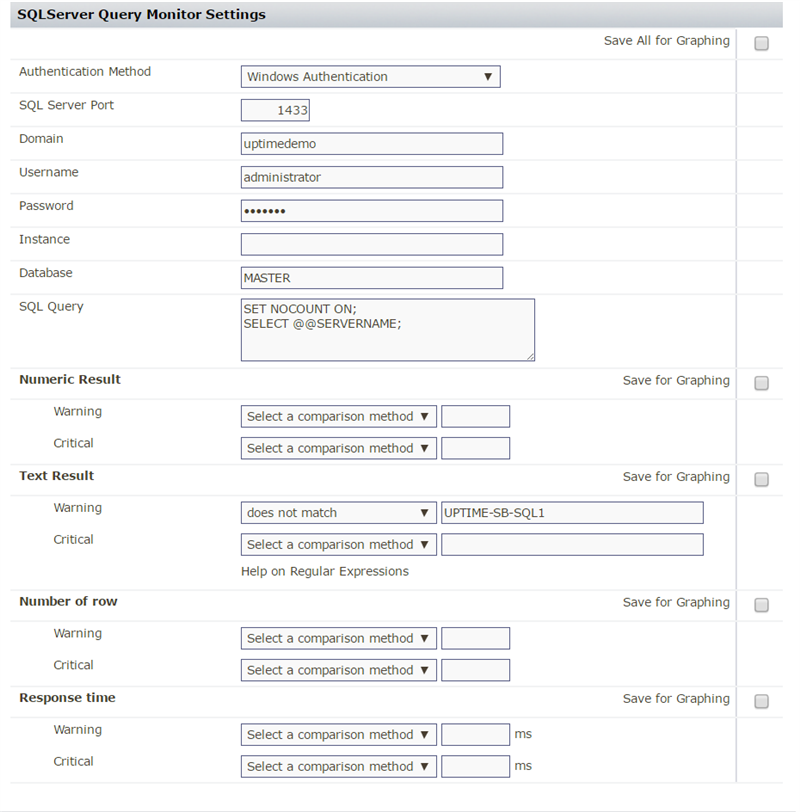
This is a custom one we’re going to do just for the cluster monitoring. You can do SO MUCH with this service monitor but I’m not even going to get off on that tangent here. Another post perhaps! For this example we’re going to query the SQL DB engine for the server name it is running on. This never lies. No matter what the virtual name is, this is going to report the actual server name the engine is on. See below:
Note I am only alerting on the Text Result field. Here you’ll want to enter YOUR preferred node’s server name. If you running on the preferred active now right now just save the monitor, test it and watch the output.
Here you can see I’m actually failed over to the second node! Works!
- SQL Server Advanced Metrics – This one monitors the actual performance of SQL Server. I always like having this and I save all the metrics and only alert on average lock and average latch wait times. They’re the only really reliable counters for alerting on this service monitor. Unless you know you want to alert on the others you can just keep the defaults. This service monitor REQUIRES the agent or WMI to work, so we’re covered there. There are no credentials needed as a result. Pretty convenient.
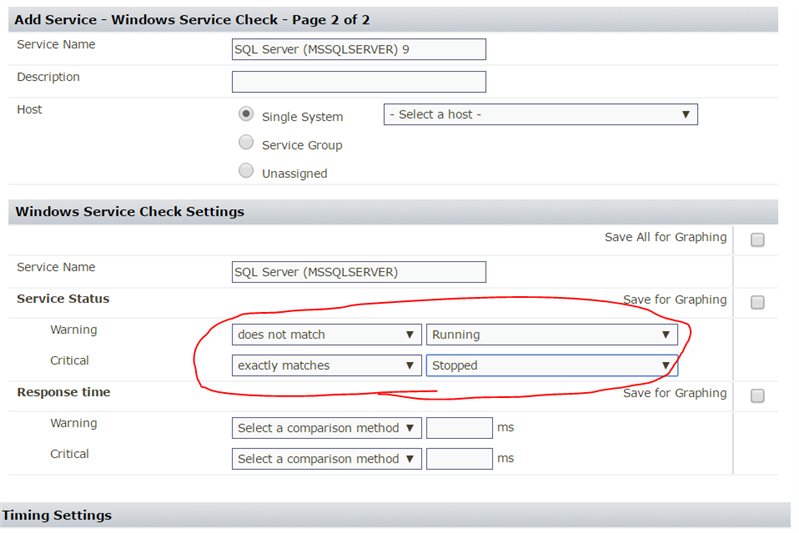
- Windows Service Check – Similar to step a in this list, this is optional. Realistically if the service isn’t running, the query tests are going to fail right away. It’s up to you whether or not you want to add the service checks at all. I’m a fan of having a bit more detail. Say the service IS RUNNING and SQL doesn’t respond. That means something to me. Here you go:
As you can see from the alerting criteria, you’ll get a warning if it is in any condition besides running or stopped, which would trigger a critical state… So, starting, stopping, unknown, are going to be warning… I don’t bother collecting any of the data here just using it as an alert. I really don’t care about response time. It’s WMI / Agent so it could take a couple seconds or so depending. I just care about the service’s state. This one is real convenient for monitoring the agent too, because if you have jobs that like to crash the agent from time to time, we could set up an action profile to start the agent back up as a reaction to us seeing it not running. Note that we would only want to do that on the virtual name element like we’re doing right now because we wouldn’t want to repeatedly and continuously try to start the agent on a passive node with no SQL DB engine running!
- Lastly, we’ll want to wrap all this up in an application. Go to Infrastructure and click Add Application on the left hand side. We are actually going to make a few applications here.
- The first let’s call “Node health”, for the “master monitors” we’ll choose the PING check, the windows performance monitor, and the file system capacity monitor, for all nodes. Our alerting criteria will be the defaults, if anything is warning, it’s wanring, anything is critical it’s critical. The idea here is we CARE about individual node health and want to know if there are issues. This info also may be audience specific, so having an application that includes all items not only represents it in an easy to understand visual way, it also allows us to alert on it as an aggregate INSTEAD of alerting on every single monitor which is just, well, ANNOYING. After you save the application, if you’d like to assign an alerting profile to it, find it in Infrastructure (you added it to the Applications group didn’t you? J ), click on the application name, not the edit icon… Scroll to the bottom and add the alert profile here. If you want to tweak all the settings like how often are we checking application health, etc, go to the service menu from the top and type in the application name in the search box halfway down the screen on the right… edit the application service monitor (yes the application is actually a service monitor behind the scenes.. See my webcast on compound monitoring).
- The second one we’ll want is SQL Cluster Health or something similar sounding. For this application add that custom SQL Query that checks the @@SERVERNAME variable as the maste service monitor. Also you can add the SQL Basic check if you created it here too. I didn’t cover it, but if you’re really paranoid, you can add a DNS check service monitor too to make sure DNS resolves to the proper IP. I don’t bother because I’m ever the pragmatist, and if I can query the SQL server and it tells me its running where I want it too it means all that is working! FYI: master service monitors determine the alert state of the application, and that’s why we add those two there. For the “regular services” we will add performance related stuff. It’s really convenient to be able to glance at the application dashboard and know that not only are you on the right node, but SQL is “happy”. This is the SQL Advanced service monitor you added in the last series of steps… We’ll keep the default alert criteria on this one as well.
- Last we’re going to create the application for the cluster as a whole. Go ahead, take a break if you need to (I’ve had another coffee while writing this!). Create another application and call it something to the effect of SQL Cluster Monitor or something so you know hey this is the daddy of monitors… Here in the master monitors, we’ll include the last two application’s you just added and keep the default alert criteria. No need for regular monitors here unless you just want to. The result here is an aggregate of aggregates. The status will swing outside of OK if there is a health issue on one of the nodes in the cluster (despite SQL) or if there is a failover issue. You may consider including the performance check that comes with the SQL Advanced check as one of the regulars here, or you may do so in the SQL Cluster Health monitor too. I don’t personally, because I want any alerts coming from this daddy monitor to REALLY mean something important… If I ever get an alert I KNOW I CARE. Alerting at the application level when you have meaningful service monitors with good thresholds tied to it, creates responsible alerting and greatly aids in troubleshooting and prevents our tool from being a noise generator. I’m sure you can appreciate this. Ok, off my soapbox!
- Now you can add alert profiles to any of these applications if you like. At the very least you’ll want to alert on the last one we made.
Ok, now, for availability groups. The process is nearly identical actually, except we’re going to apply all of the monitors to all of the nodes. MSSQLSERVICE Service monitor, advanced, basic, windows performance and file system monitoring, but we will only do the SQL Query that queries the virtual name against either the CLUSTER’S virtual host name or the AVAILABILITY GROUP DNS name itself. This depends on your goals… If I want to watch when a database supported by the AA/AG functionality moves nodes itself this is how I would do it. Do not fret, you do not have to add a separate element for EVERY availability group! Just add an element via agent for the CLUSTER virtual node so we know we’ll (theoretically) always have SOMETHING to connect to. (I use caps a lot.. probably the coffee…) Then you’ll create a SQL Query service monitor to query the status of each AVAILABILITY GROUP individually. The query below will check if the listener is active for the availability group, just replace ‘uim-clust’ with your availability group’s listener name in the WHERE clause:
SET NOCOUNT ON;
select
-- uncomment following line to test
--agl.dns_name, aglia.state_desc,
hags.primary_replica from sys.availability_group_listener_ip_addresses aglia
JOIN sys.availability_group_listeners agl
ON agl.listener_id = aglia.listener_id
JOIN [sys].[dm_hadr_availability_group_states] hags
ON hags.group_id = agl.group_id
--comment the following line to return all groups for testing where agl.dns_name = 'uim-clust';
This query will return the SERVERNAME of the currently active primary replica.
As before, we can simply put a warning condition where if the text output does not match the node you want to be the primary replica, alert criteria is met. Since I want UPTIME-SB-SQL1 to be the primary at all times, I would put WARNING if it doesn’t match UPTIME-SB-SQL1.
And there you have it. This same service monitor can be created one for each availability group that runs on your cluster. Each of them could be used as regular service monitors in the cluster health application we created earlier. That way if any of your availability groups is not running on the node you expect, an alert condition is met. There are lots of other properties you might query against to create service monitors in Uptime with regards to clusters, availability groups, and numerous other things from performance to backup states, etc. I hope this guide has served to help you in your journey.


