With PRECISE you can identify and tune your problem SQL queries in a few clicks.
PRECISE tells you what are your heaviest SQL queries and identifies them as Findings. See the blog PRECISE – a performance monitoring approach that resolves issues quicker for more information.
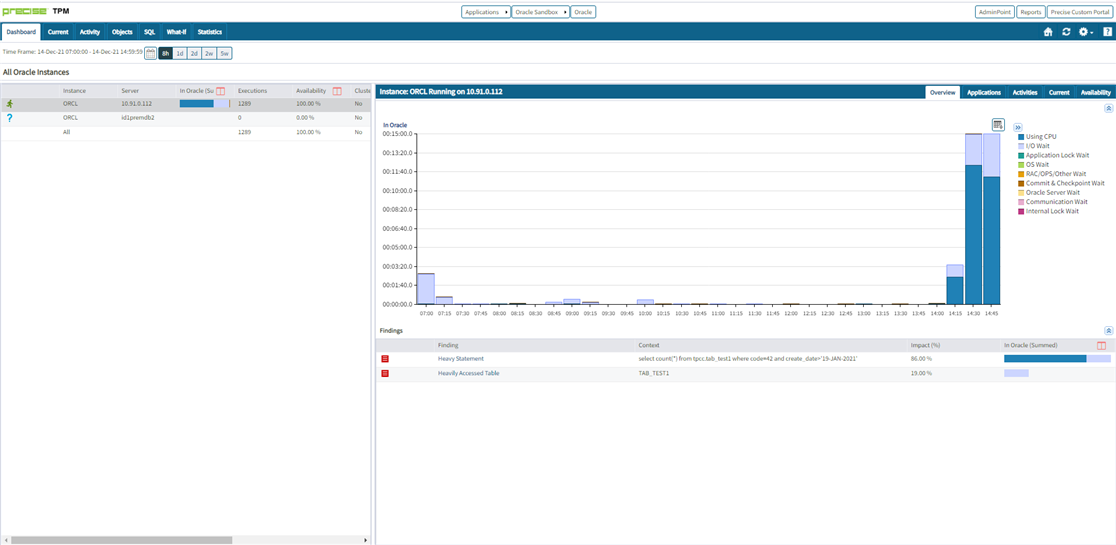
The Findings tab shows the heaviest SQL query. You can see in the example below that this query is consuming 86% of the time in Oracle.
By clicking on the Heavy Statement link you can see details about the query.

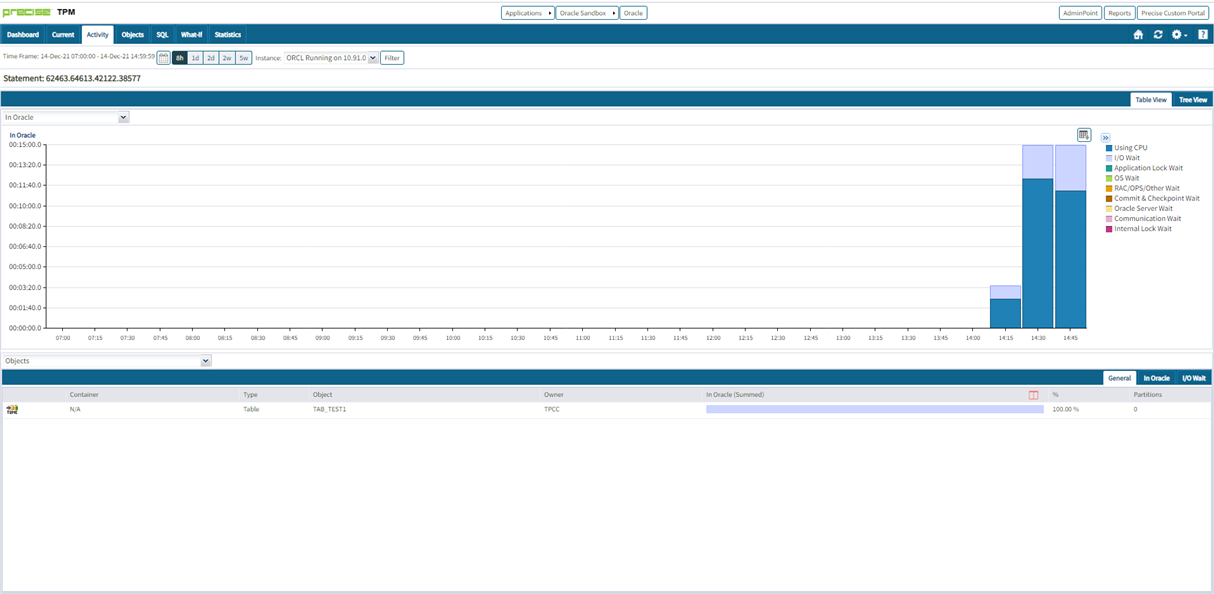
By clicking on the ‘statement activity’ link you can see how frequent the query is executed.
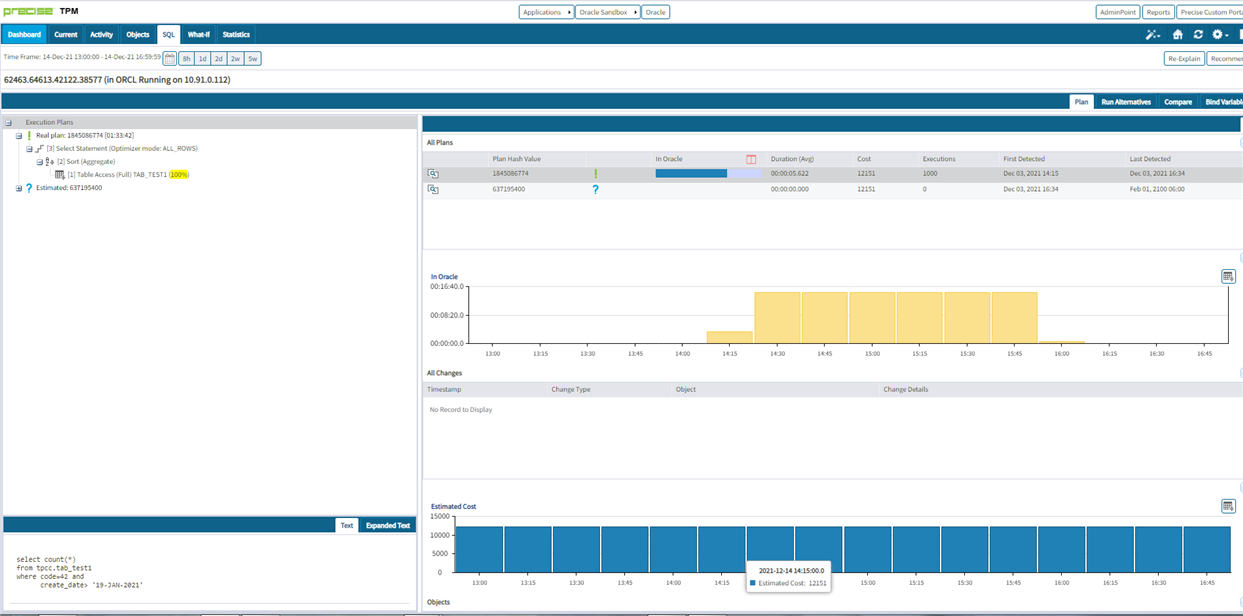
You can click on the ‘Tune the statement’ link which will then take you to the SQL tab and show details of the query including the execution plan.
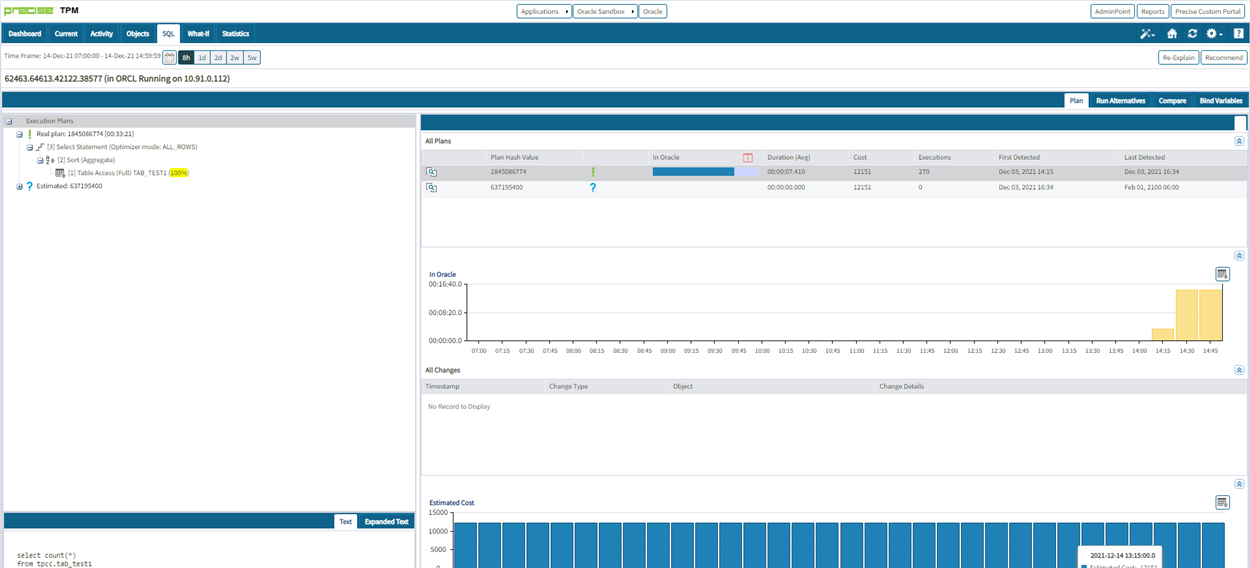
You can see in this example that there is a Table Access Full Scan
By clicking the Recommend Tab PRECISE will identify any recommendations for this query.
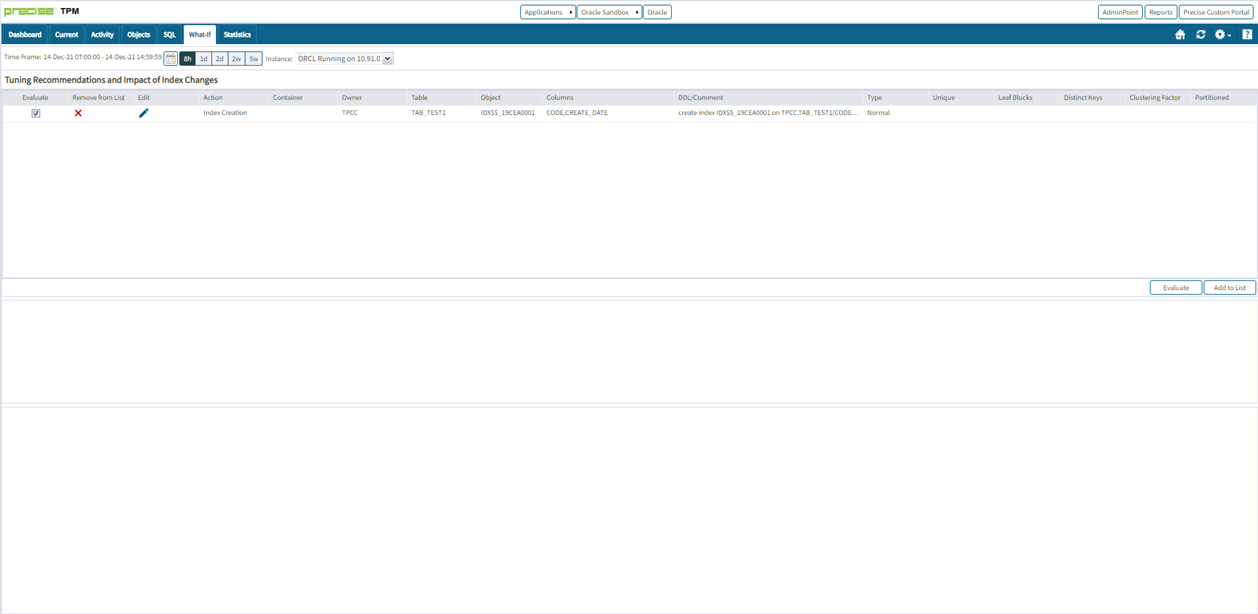
It has identified an index for the table.
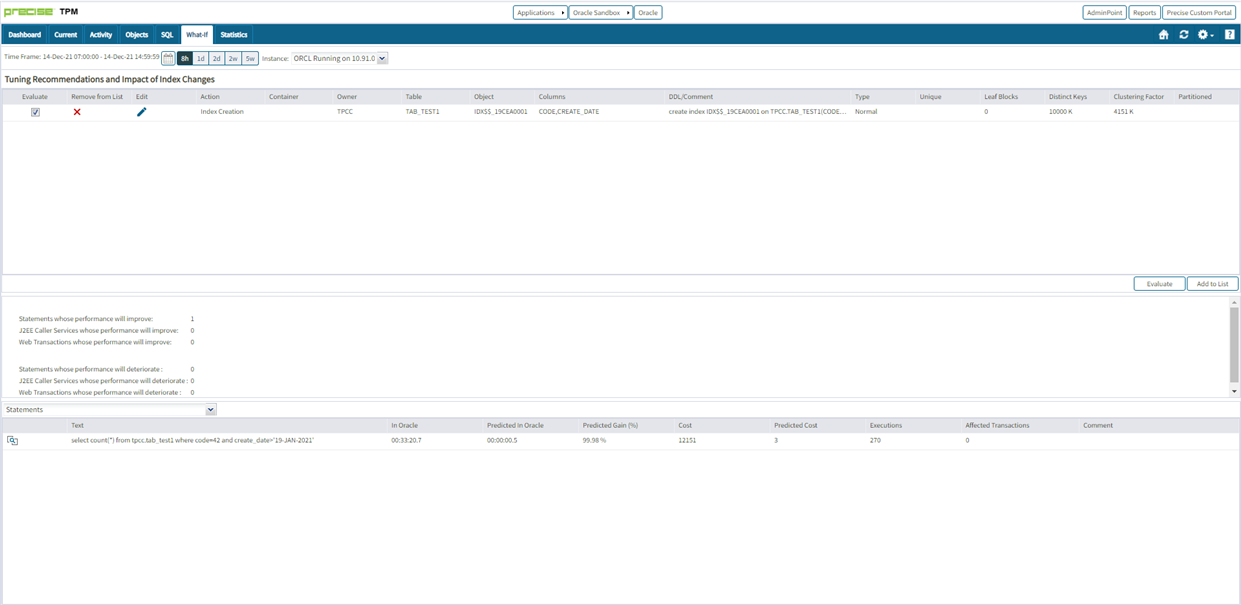
You can evaluate the index recommendation and confirm that it will benefit the query and has no negative impact.
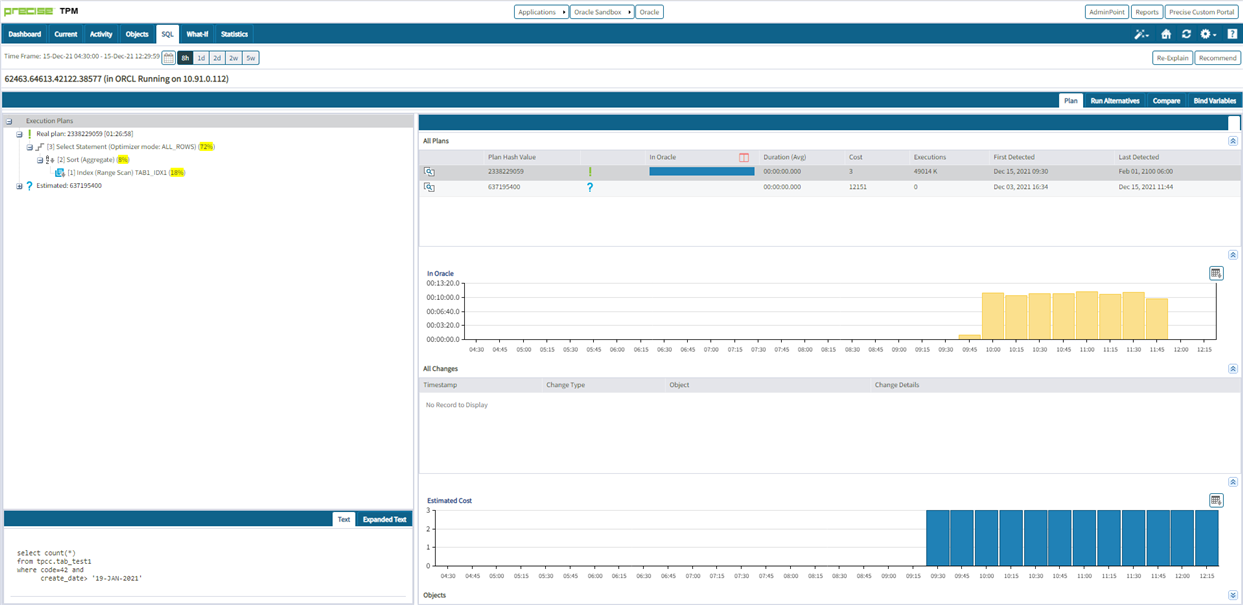
Once you have added the index PRECISE can then show you the improved performance of the SQL query.
We can compare the execution plans and see the change. The next screenshot shows the initial execution plan with a Full Table Access Scan
This changes to an index range scan after we have created the index on the table
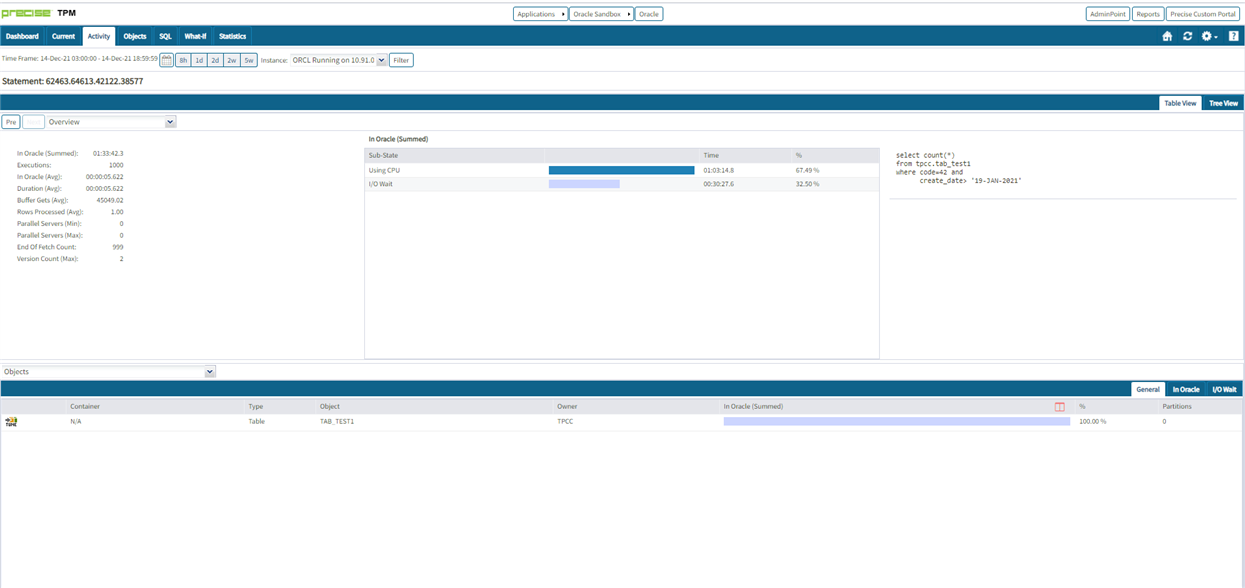
There is also a change in the cost of the statement. This screenshot shows you a high average buffer gets (45049) and also costly average execution time of 5.6 seconds for the Full Table Access Scan.
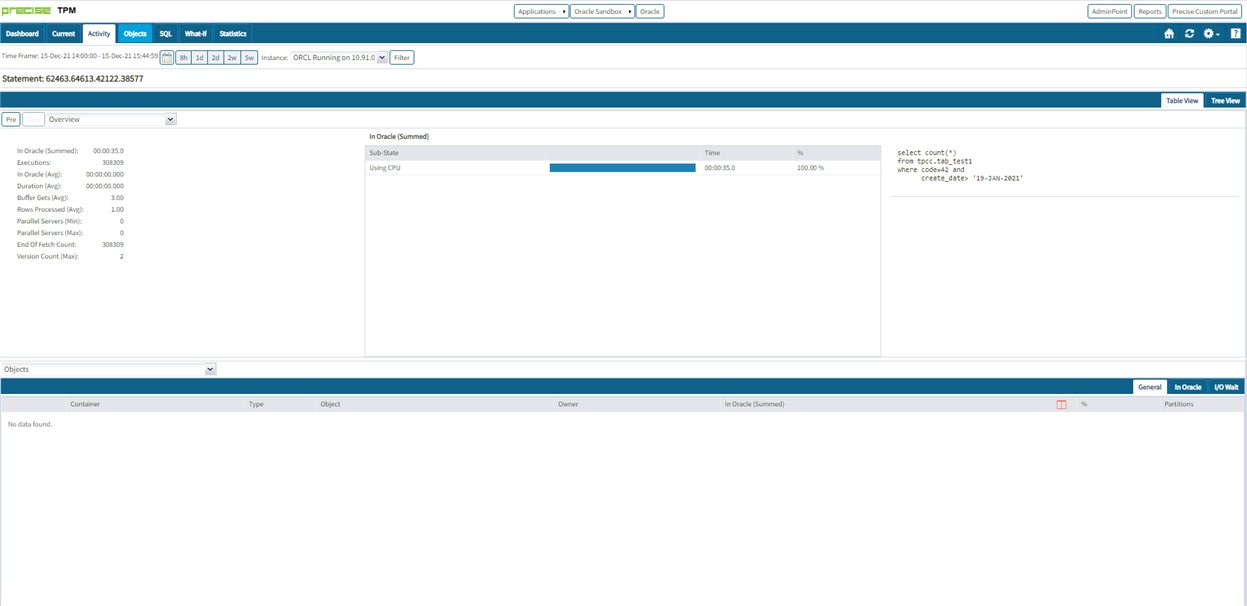
After the index has been added we can see the number of buffer gets is a lot lower with only 3 and the average execution time is very low too.
In summary, we can see that with PRECISE you can identify, diagnose and tune your SQL queries within a few clicks.
Check the following details to find out more about PRECISE
Learn more:
Precise Application Performance Platform
Download and install your Precise V10.3.1 software from here or from the Precise Support Portal.
