Autogrowth in your tempdb database may not seem like such a bad thing, but it can cause quite a headache if it’s uncontrolled. Unplanned autogrowth can slow the performance of your SQL Server while the growth is occurring (especially if Instant File Initialization is not enabled), and if your data files are not all the same size, tempdb contention may begin to rear its head as soon as the autogrow completes. Today I’m going to show an example of what you see in DM when an autogrow occurs, and walk through a troubleshooting session to identify what caused the issue.
Enabling Autogrow Alerts
There are two steps to enable autogrow alerts in DM, both of which are configured by default. First, go to Monitored Server Properties and to the Activity Monitor tab. Ensure that “Enable the Activity Monitor” and “Capture Autogrow” are both checked. Second, go to Configure Alerts on the monitored server and ensure that Data File Autogrow is enabled.
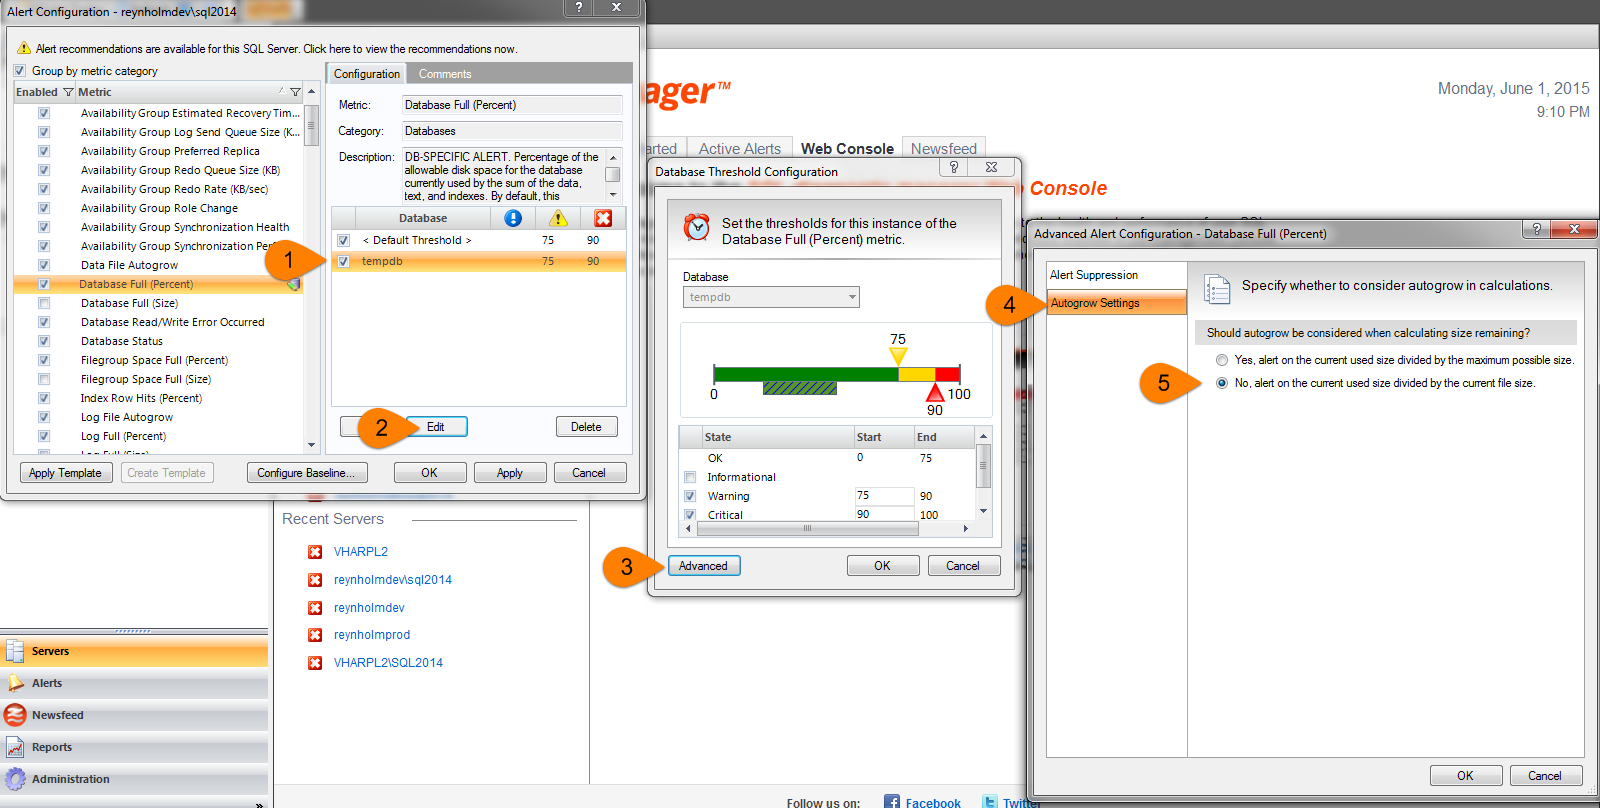
If you’d like to get alerts prior to autogrowth occurring you can set up a specific alert for this purpose under Database Full (Percent). First, click “Add” and select tempdb to create a database-specific alert. Then select the tempdb threshold, click Edit, then Advanced, and then Autogrow Settings. Change the setting to “No, alert on the current used size divided by the current file size.” Now you will receive an alert for tempdb when the files are getting close to autogrowing. The image below shows the necessary steps (click to enlarge).
Troubleshooting Autogrow
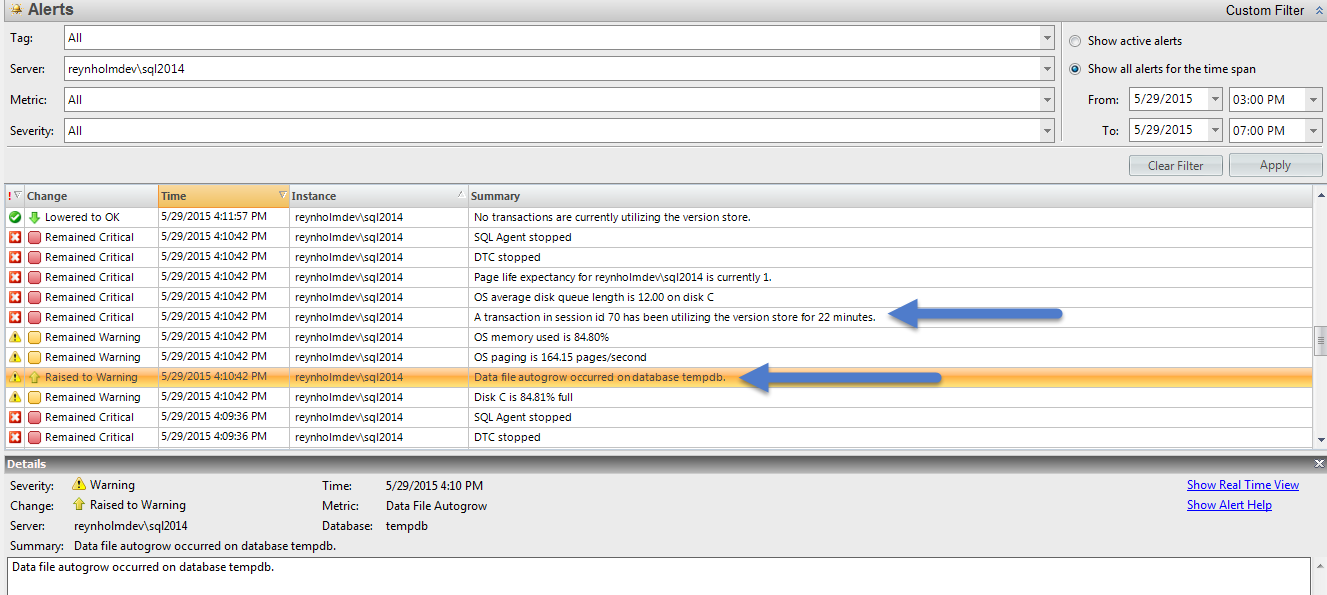
When autogrow occurs you should take a look first at the other alerts which may have been occurring at the same time. In the screenshot below you can see that not only has autogrow occurred, but there is also an alert on a long running version store transaction. These transactions keep the snapshot isolation version store – which is located in tempdb – from being able to be cleaned up, which is a common cause of uncontrolled growth.
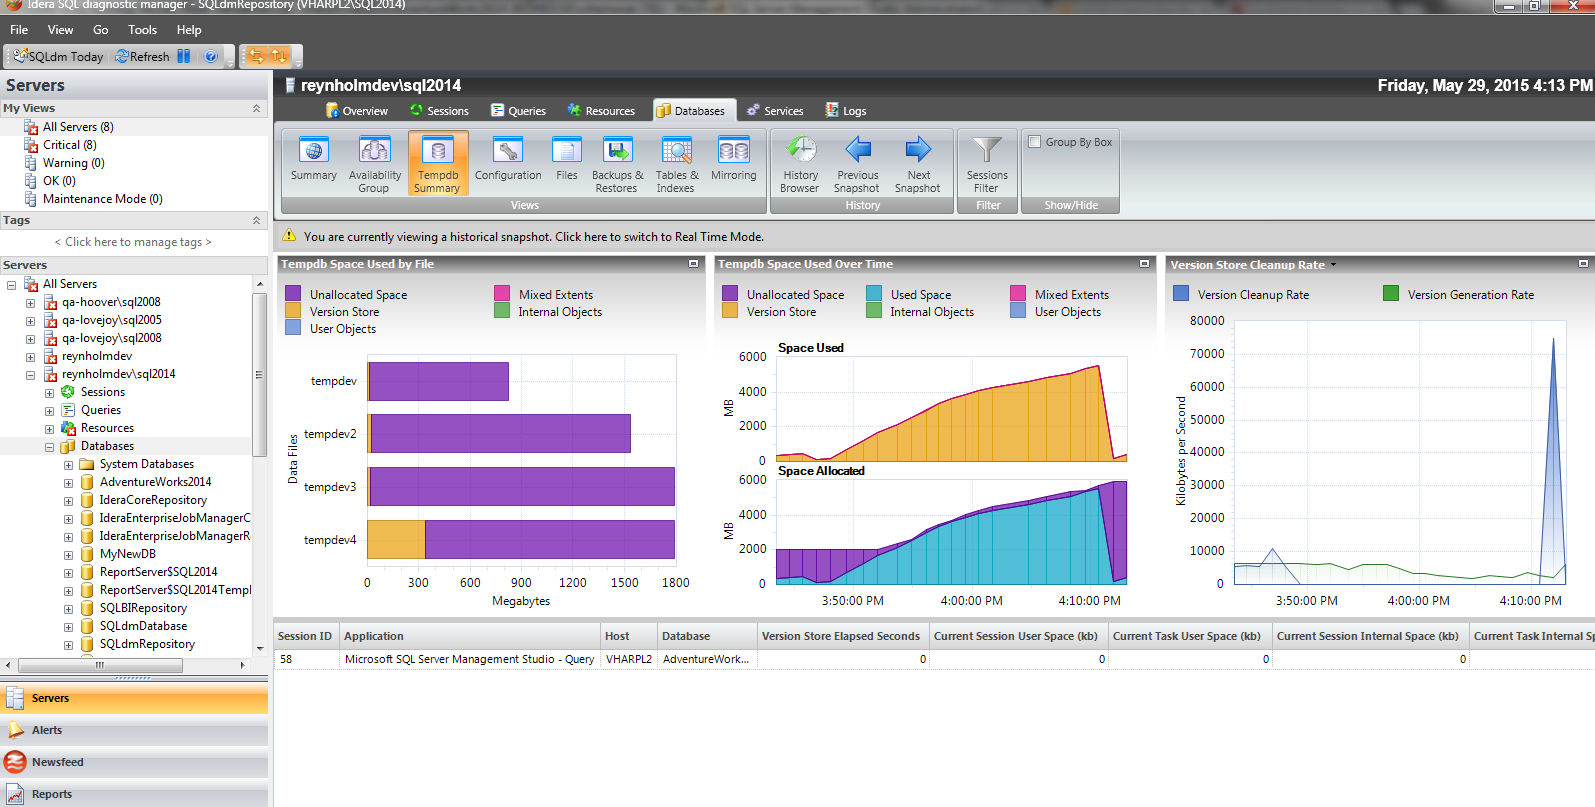
Having established a timeframe for the issue, you can use the history browser and the Tempdb Summary view to identify the type of objects which were using space in tempdb at the time growth occurred, and where relevant, you can also see the sessions which were making use of those objects. In this screenshot we can see that the version store did indeed grow very large before abruptly dropping off – you can see a spike in the cleanup rate for the version store as well. This shows that the problem transaction eventually did end, but not before causing data file growth. You can also see that the files did not grow evenly, which will make this instance more likely to experience tempdb contention.
Click the “Previous Snapshot” and “Next Snapshot” buttons to move through time until you are able to spot the problem transaction in the lower panel of the screen. Then you can take a look at the session itself – you can right click on the session to view session details, locks, and the query history for that particular command.
Need more information on troubleshooting tempdb in SQL Server? I will be presenting a Geek Sync this Wednesday on the topic of tempdb monitoring. Click here to find out more, or, if you’ve missed it, hop on over to the community forums and I’ll be happy to help you out!