IDERA is pleased to announce the introduction of IDERA SQL DM Performance Insights, a Microsoft Azure Data Studio (ADS) extension which displays key performance metrics for SQL Server that have been collected and stored in a database repository by IDERA’s SQL Diagnostic Manager (SQL DM). SQL DM is a scalable, multi-server performance monitoring, alerting and diagnostics solution for SQL Server. It proactively notifies administrators to health, performance or availability problems via a desktop console, web console add-on or mobile device.
Microsoft Azure Data Studio (ADS) is a new cross-platform desktop environment for data professionals using the Microsoft family of on-premises and cloud data platforms on Windows, MacOS, and Linux. Developers can easily build extensions to the environment that can be downloaded and installed in Azure Data Studio.
This extension is a free add-in for Azure Data Studio that quickly allows you to see high level aggregated performance issues across multiple servers monitored by SQL Diagnostic Manager.
This preview provides the following features:
Servers: display metrics such as CPU, Disk I/O, Network and Memory Used
Sessions: display session summary averages such as Client Connections, Logins, User Processes, Transactions, and Oldest Open Transactions
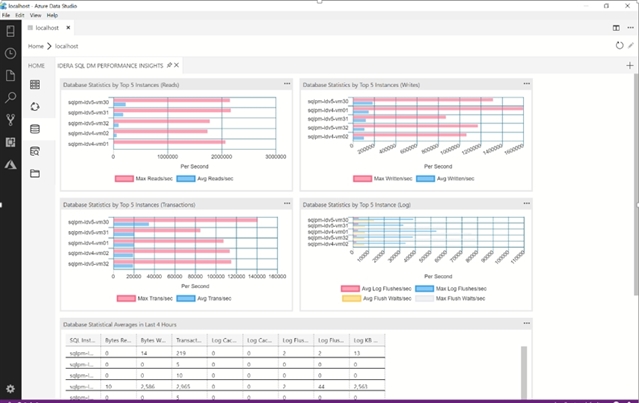
Databases: display database summary related statistics such as Reads, Writes, Transactions and Log activity at the server level as well as database statistical averages at the database level
Queries: display Wait Statistics and summaries of Query Statistics
This extension is provided free of charge and will be supported through the IDERA Community Free Tools.
Downloading and Installing Azure Data Studio
Before you can use IDERA SQL DM Performance Insights, you must first, download and install the latest version of Azure Data Studio. For information on how to do that, please refer to Download and install the latest release.
Downloading and Installing IDERA SQL DM Performance Insights
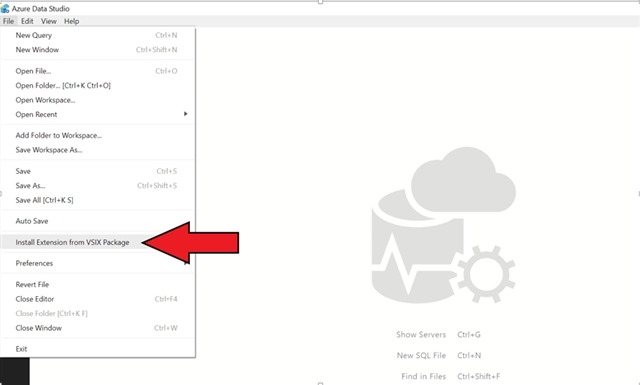
Before you can use IDERA SQL DM Performance Insights extension, you need to first download it from here. The ZIP file will contain a readme file and a VSIX extension package. To install the extension, open Azure Data Studio and select File -> Install Extension from VSIX package and select the VSIX file that was extracted.
Click Install. You will be presented with a prompt – “This is a third-party extension and might involve security risks. Are you sure you want to install this extension?”. Select Yes.
Another prompt will appear – “Successfully installed the extension. Reload to enable it.” Select Reload Now.
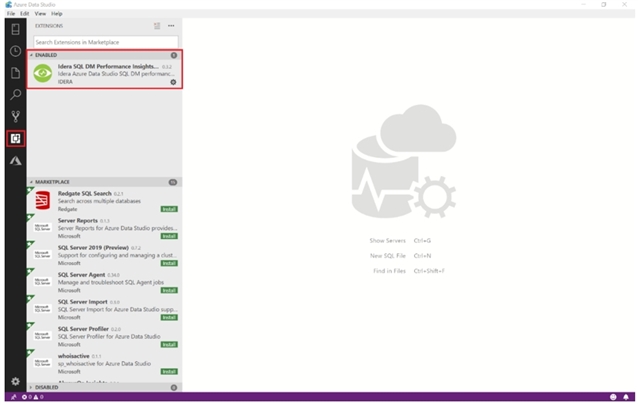
Check to see if the extension was installed successfully – Select the extensions tab on the left-hand side and check the enabled extensions for “IDERA SQL Performance Insights”.
IDERA SQL DM Performance Insights has been successfully installed.
Adding a Connection to SQL DM Repository
Before you can begin using IDERA SQL DM Performance Insight, you will first need to have access to an IDERA SQL Diagnostic Manager repository. For existing customers, locate a SQL Server instance that the SQL DM repository has been installed on or obtain a trial of IDERA SQL Diagnostic Manager here and set it up to start collecting data first.
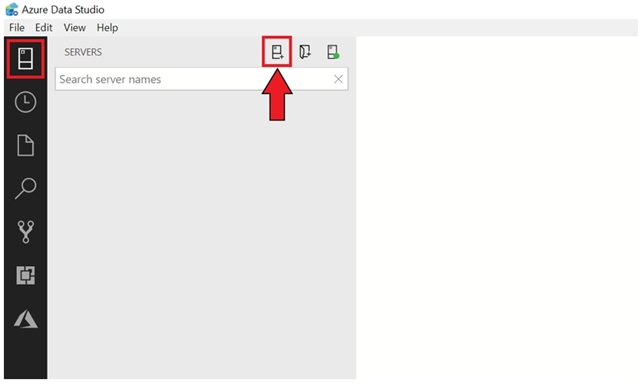
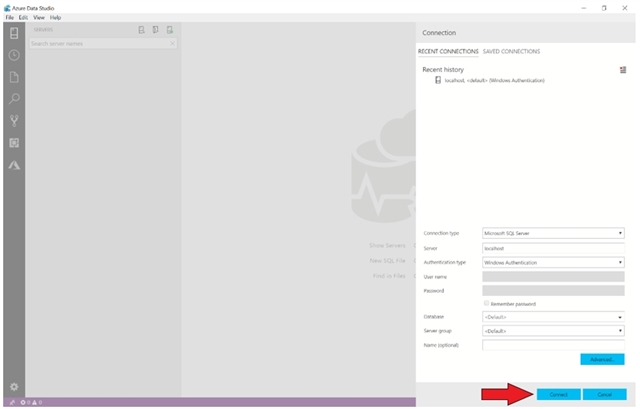
To add a new connection, select New Connection in Azure Data Studio, complete the Connection information dialog and select Connect.
The connection will appear in the SERVERS pane of Azure Data Studio.
Using IDERA SQL DM Performance Insights
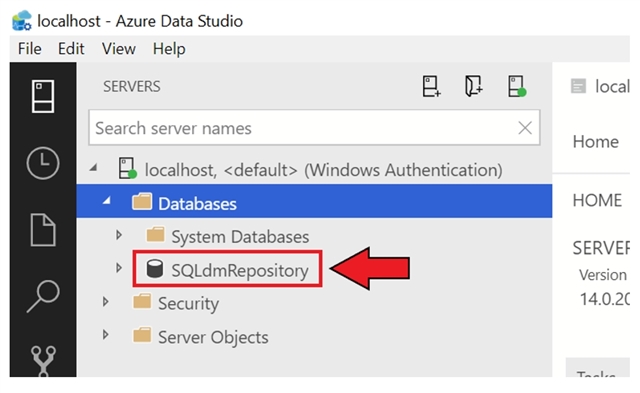
To verify that you have the correct connection, select the connection you just added, select the Connection and open the Databases tree and verify that “SQLdmRepository” is available.
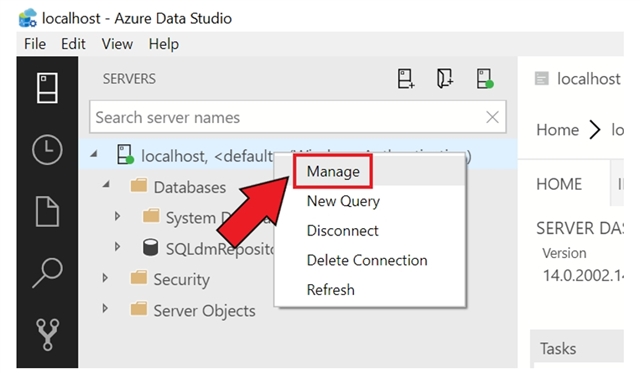
To start using IDERA SQL DM Performance Insights extension, select the Connection and make sure the icon is green, right-click the name and select Manage.
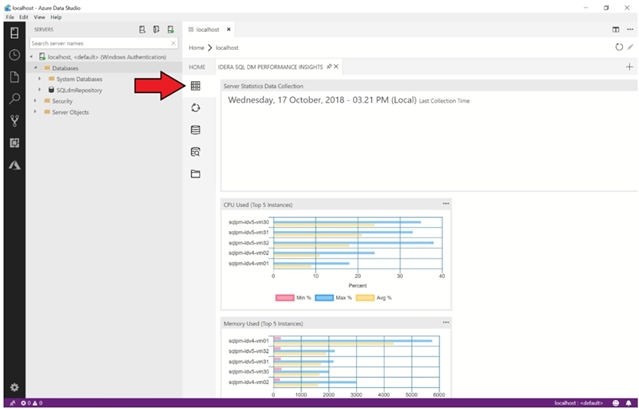
The IDERA SQL DM PERFORMANCE INSIGHTS tab should appear in the right-hand pane. Select the tab to begin using the available views in the navigation bar.
Overview of available views
Servers
To select this view, select the Servers icon in the Navigation bar.
This view displays metrics such as Last Collected date, CPU, Disk I/O, Network and Memory.
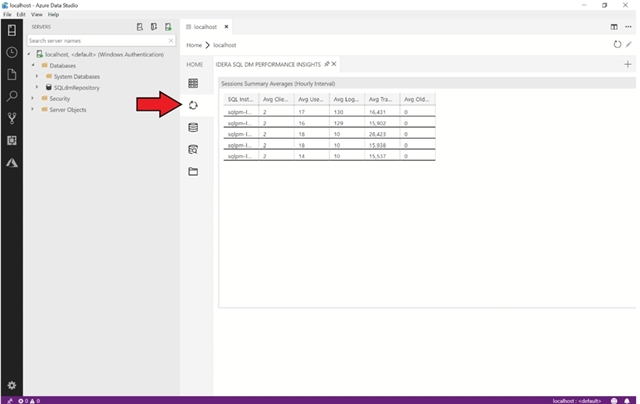
Sessions
To select this view, select the Sessions icon in the Navigation bar.
This view displays session related statistics such as Client Computers, Logins, User Processes, Transactions, and Oldest Open Transactions.
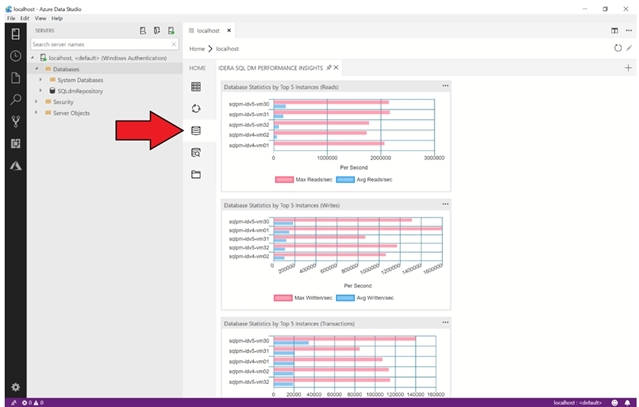
Databases
To select this view, select the Databases icon in the Navigation bar.
This view displays database summary related statistics such as Reads, Writes, Transactions and Log.
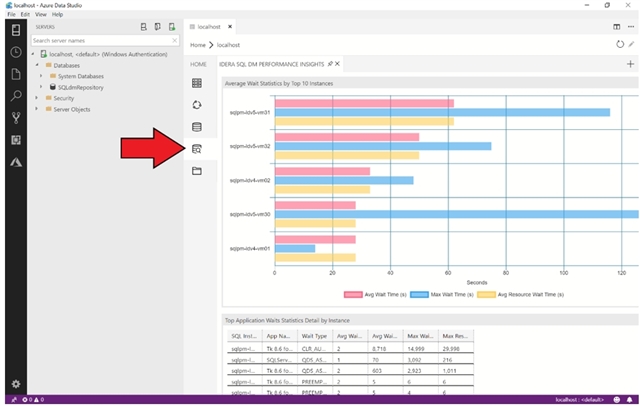
Queries,
To select this view, select the Queries icon in the Navigation bar.
This view displays Wait Statistics and summaries of Query Statistics.
Help
To use IDERA resources related to this extension, select the Help icon in the Navigation bar.
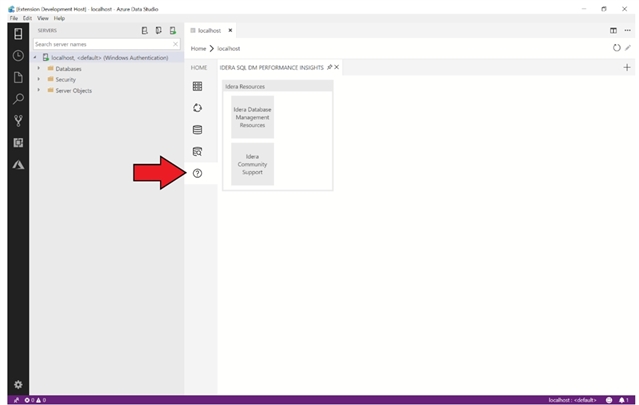
To get help or information on this tool, select IDERA Community Support task. This will open an IDERA Community Page for getting information and posting feedback.
Using Azure Data built-in features
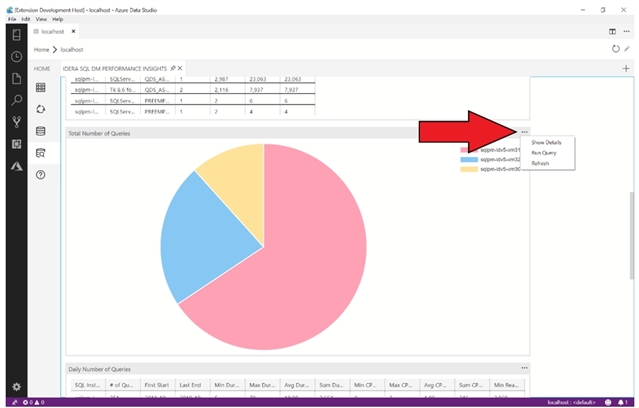
The visualizations in the above views contain several features that are available by selecting the chart ellipse in the top right corner. To use these options, click the ellipse and select the context menu.
Show Details
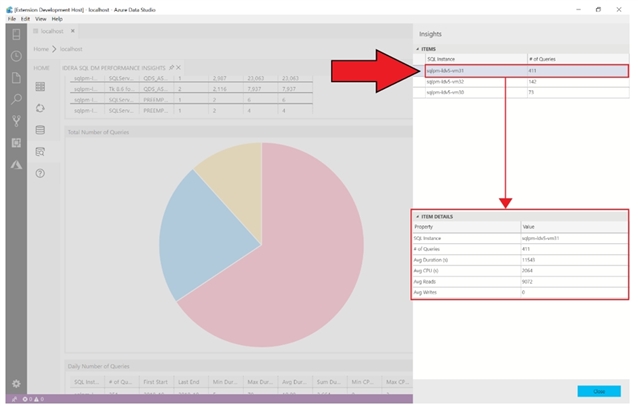
Show details will provide a fly-out pane that shows an item and item details represented by the selected chart. The visualization in this extension that shows how this feature works is Queries – Total Number of Queries. To see how this works, select Queries view, click the ellipse and select Show Details. An Insights pane will appear. Select any item in the top pane and more details will appear in the bottom pane.
To close the Insights fly out, select Close.
Run Query
Run query allows you to see the underlying query that is supplying data for the visualization. To see how this works, select any visualization, click the ellipse and select Run Query.
When you are done using the query tab, close the tab to return to the return to the previous screen.
Refresh
Refresh allows you to re-run the query to refresh that data. To see how this works, select any visualization, click the ellipse and select Refresh. If any of the underlying data has changed, the visualization will update to show the new data.
Summary
In this brief introduction, we explored the IDERA SQL DM Performance Insights for Azure Data Studio. Azure Data Studio is the new open source, multiplatform tool for working with SQL Server. We began by seeing how easy it is to install the Extension looked at some features. Azure Data Studio and IDERA SQL DM Performance Insights is a great way for an IDERA customer to get multi-server insights into the servers that they are monitoring with IDERA SQL Diagnostics Manager.
For more information about IDERA, please visit www.idera.com.
To download SQL DM Performance Insights, please visit: SQL DM Performance Insights
For more information about Microsoft Azure Data Studio, please visit https://docs.microsoft.com/en-us/sql/sql-operations-studio/release-notes.
