For every online business, there are millions of transactions happening every second including crucial revenue bearing transactions. Therefore downtime, both planned and unplanned has a cost attached to it and results in lost revenue every second. As the technology improved to meet this demand, the importance of High Availability (HA) became the focus point.
The introduction of Galera Cluster for MySQL bought true Multimaster Cluster thanks to its synchronous replication. In this article, we’ll show how using Monyog in tandem with Galera provides a simple and best-in-class High Availability solution for MySQL users.
How to register a Galera Cluster Node in Monyog
- Enter the Hostname, port and credentials in “MySQL settings”, test the connection and save it.
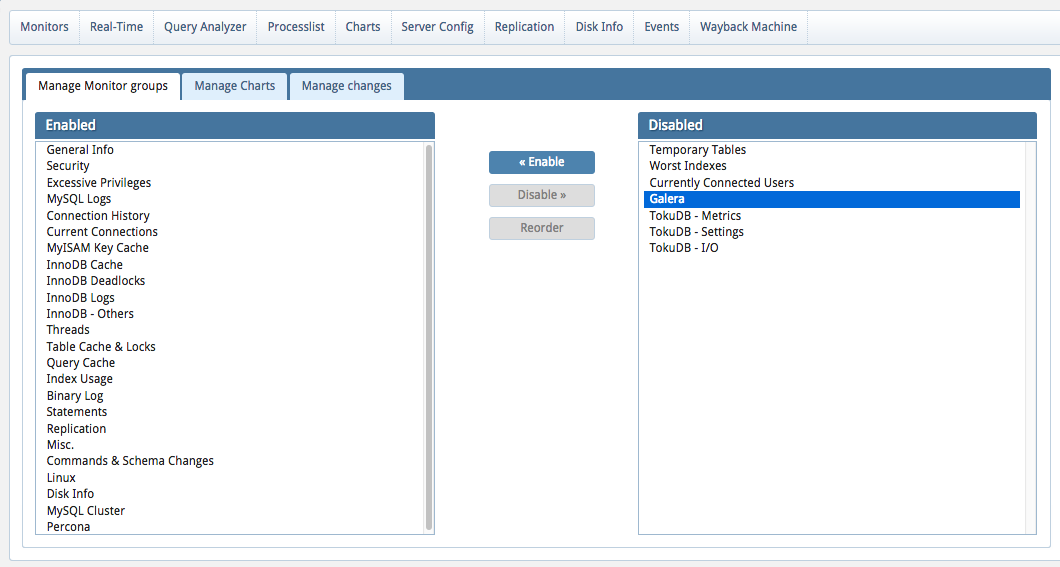
- Enable “Galera” group from “Customize” > “Manage monitor groups”
- In Monitors page, select the “Galera” group and you’re all set.
Setting up Galera Charts
With the monitors setup, it would be nice to have a chart to monitor the health of the MySQL cluster. In the Charts tab, click on the gear icon on the right and select ‘Add a new Chart’.
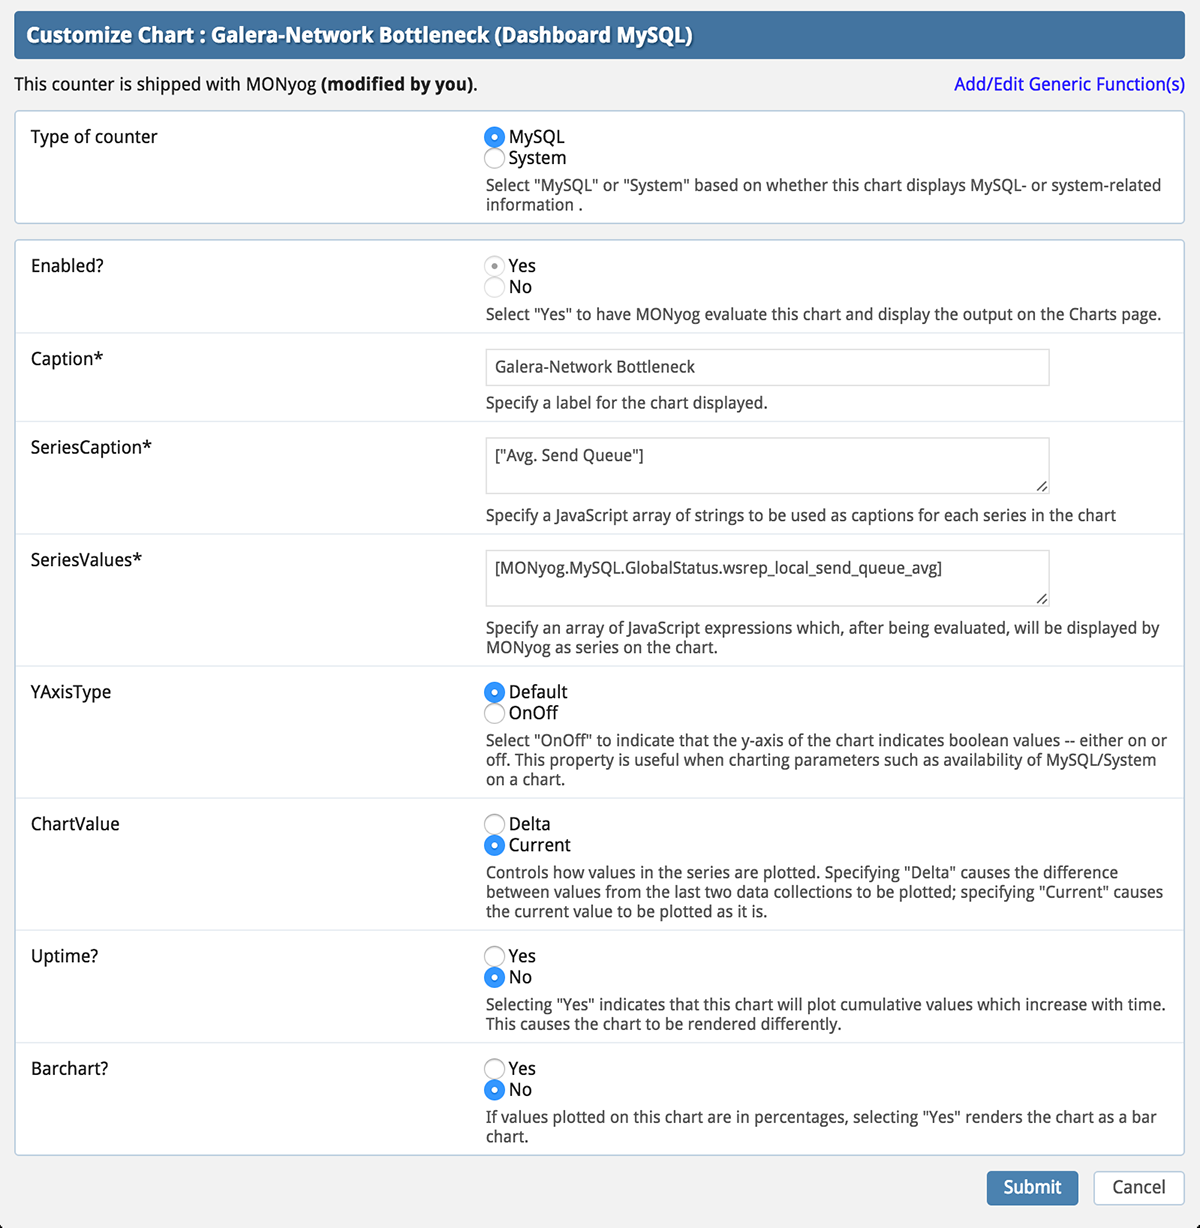
Let’s create a Chart to view bottleneck in replication between the Galera nodes. This can be done by monitoring the status variable wsrep_local_send_queue_avg
Add a Series Caption and in Series Value add: [MONyog.MySQL.GlobalStatus.wsrep_local_send_queue_avg] also set the ChartValue to Current.
Let’s create another Chart to show the %time Galera replication was paused.
Add a Series Caption and in Series Value, add: [ToInt(MONyog.MySQL.GlobalStatus.wsrep_flow_control_paused) * 100]
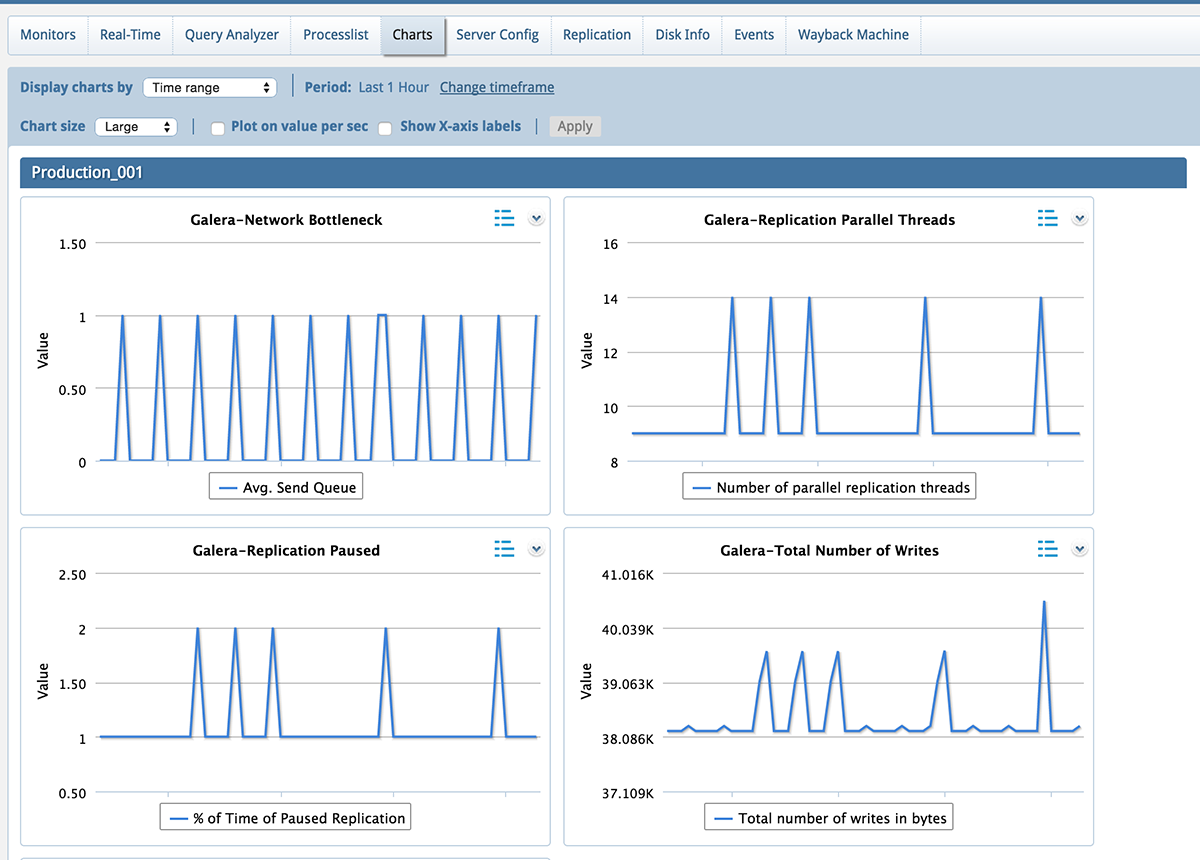
Once the Galera Charts are setup, your Monitors tab will look something like this.
Galera monitors shipped with Monyog
Here are the monitors currently available in Monyog. You can hover on them to view advisors and customize as per your requirement.

Alerts for Galera
With Galera Charts in place, all you need is alerts to complete the Galera Cluster monitoring setup. Using this, you can make Monyog alert you when a condition is triggered.
Monyog supports one default alert for wsrep_ready status variable in the Galera Monitors tab. You can manually enable alerts for any variable. For example, if you want to setup an alert to find out network bottlenecks, here’s how you do it:
- Go to Monitors tab, select the Galera group, click on ‘Find network bottleneck’.
- In the popup, click on Customize.
- On the top-right part of the page you’ll find an option to ‘View advanced’. Click on it and scroll down to see a text area for ‘Alert condition’.
- Now you can write your own alert condition like this:
function() {
if( parseInt(this.Value) >= 1)
return "Critical";
else if ( parseInt(this.Value) > 0.5)
return "Warning";
else return
"None";
}
If you’re new to Monyog, give it a try and start monitoring your MySQL/MariaDB Galera Clusters. If you have any feedback or questions, drop a comment below.