In week 5 of our Benefits of SQL Diagnostic Manager for MySQL blog series, we detail MySQL and MariaDB monitoring features with SQL Diagnostic Manager for MySQL, including real-time monitoring and monitoring MySQL error logs. If you missed it, you can read our previous post on understanding database performance trends.
Fast Startup Time to Start Monitoring
Database administrators can start monitoring MySQL and MariaDB servers in less than a single minute. The unique architecture and low-footprint of SQL Diagnostic Manager for MySQL enable database administrators to install and configure all of the components that are required for monitoring MySQL and MariaDB servers very quickly.
The fast startup time is in sharp contrast with other monitoring and advisory tools for MySQL and MariaDB. Before database administrators can even start monitoring MySQL and MariaDB servers, such tools require installing agents, web servers, multiple language runtimes, and more.
Real-Time Monitoring
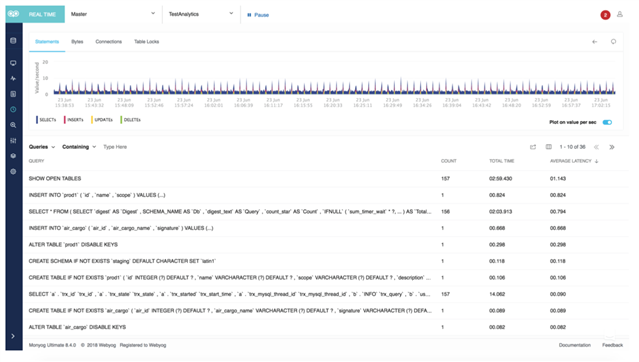
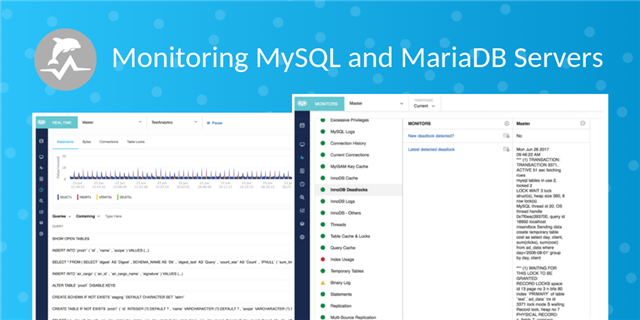
The Real-Time feature enables database administrations to know what is happening to MySQL and MariaDB servers without delay. With a single click of a mouse button, obtain critical data (such as the top 200 SQL queries, slow SQL queries, locked and locking SQL queries, along with the most active users, hosts, databases, and tables). There is no need to enable slow query logs and general query logs. SQL Diagnostic Manager for MySQL records the data in sessions, and saves the sessions for later analysis.
Monitor Error Logs
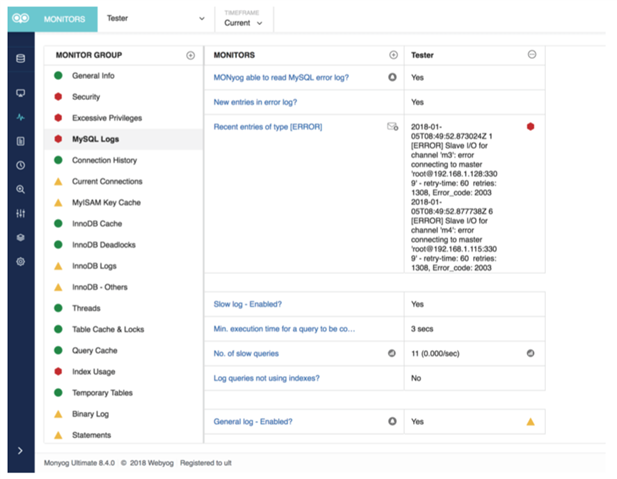
Monitoring MySQL error logs is critical for any database administrator. SQL Diagnostic Manager for MySQL is the first monitoring tool for MySQL and MariaDB to monitor MySQL error logs. It sends notifications over simple mail transfer protocol (SMTP) and simple network management protocol (SNMP) for error log events that require attention.
Monitor Deadlocks
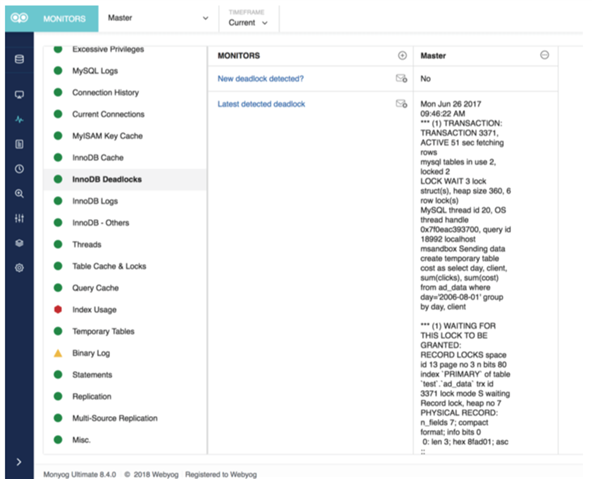
SQL Diagnostic Manager for MySQL monitors MySQL and MariaDB servers for deadlocks and optionally sends alerts immediately in the form of emails and simple network management protocol (SNMP) traps. In addition to detecting deadlocks, it also provides data on the latest deadlock found.
Create Custom SQL Objects
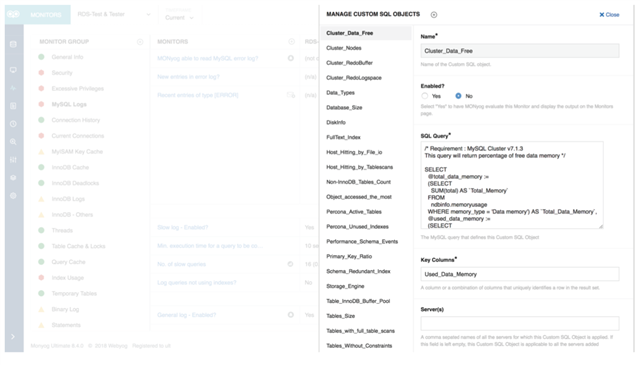
Instead of monitoring MySQL and MariaDB servers by writing SQL queries, create Custom SQL Objects. Custom SQL Objects return an array of MySQL rows. SQL Diagnostic Manager for MySQL exposes these rows as a JavaScript array, monitors it, and references it like any SQL Diagnostic Manager for MySQL object.
Read more in the full solution brief.
Find and fix MySQL performance problems on-premises and in the cloud with SQL Diagnostic Manager for MySQL.
