This blog describes how to identify queries that cause a sudden spike in system resources as well as the user and host who executed the culprit query using the Monyog MySQL Monitor and Advisor.
How many times have you seen a system go live and perform much worse than it did in testing? There could be several reasons behind bad performance. For instance, a slow running query in MySQL can be caused by a poor database design or may be due to higher-than-normal latency in network communication. Other issues such as using too few or too many indexes may also be a factor. This blog will identify the types of poorly performing queries and outline some concrete strategies for identifying them using monitoring. Finally, some tips for improving performance will be presented.
The Effects of Misbehaving Queries
Typically, misbehaving queries will result in two possible outcomes: high CPU usage and/or slow execution. The two issues tend to be related to some degree, because one will lead to or exacerbate the other. Depending on the root cause, the problem may be a database configuration or query issue. For instance, as MySQL databases grow in size, tables get fragmented over time. This contributes to MySQL load spikes. Protecting a server from MySQL high CPU issues requires close monitoring and periodic optimization of the database. Meanwhile, a query that requires a high degree of type conversion will also place a burden on the CPU.
Identifying the culprit requires a different approach based on the dominant outcome: high CPU usage and/or slow execution. In the next sections, we will examine how to track down both causes.
Some Well-known Causes of Slow-running Queries
Without knowing the root cause of a slow running query, it’s difficult for a DBA to troubleshoot the problem. Therefore, the first step should be to check efficiency of all the database components before going to use a query monitor or optimizer. This check will help to understand whether the root cause of the problem is related to a query or something else. Here are a few potential causes to consider:
- Network latency: Is the slowness limited to a specific query, batch process, database, or are other network resources suffering as well?
- Another reason behind SQL performance issue could be a bad index creation or accessing a bad index from the specified queries.
- Choosing a slow execution plan may degrade performance.
- Running a single query at a time may go smoothly, but check if running multiple queries at the same time hampers server performance.
- If someone is experiencing a bad performance issue with database components, then a System Monitor can be quite helpful. By employing a System Monitor, performance of both database and non-database components can be monitored.
- Ad hoc SQL queries that are run outside of a stored procedure: stored procedures almost always offer better performance because MySQL can cache their execution plans; ad hoc queries should, whenever feasible, be converted to stored procedures.
- Long-running or CPU-heavy queries in execution plans. Table scan operations indicate the lack of a suitable index, and putting an index in place to eliminate the table scan can have an immediate and positive effect on performance.
- Queries that include a large number of joins. Joins take time, and while MySQL Server is obviously designed to handle them, a large number of joins can really slow things down. A good general rule of thumb is to limit the number of joins to seven; if you have more than that, you may have to start looking at ways to cut back.
- A slow-running query that always runs slowly. This is a query that could perhaps be rewritten to perform better. A query that runs slowly some of the time is one that’s likely being affected by outside factors, such as locks or resource contention.
Employing Monyog Tools
Using a Monitoring and Profiling tool such as Monyog will help in improving the performance issues that are related to queries. Monyog can display long running queries (Queries that holds a large number of resources) in MySQL, as well as a host of other potential issues, such as hanging threads and improper index usage – i.e. over or under utilization.
The Overview Page
As soon as you’ve logged into Monyog, the Overview page provides a high level picture of all the selected servers registered with Monyog. Below the count of the total servers registered with Monyog, total number of disconnected servers, and servers having critical alerts and warnings, you’ll find the top 10 queries across the selected servers in Monyog, based on total execution time:

Monyog Overview – Top 10 MySQL queries
Queries with the longest execution times are positioned at the top of the list, giving you an immediate place to start looking at bottlenecks. You can click on a query to get more details. These give the list of server names on which the particular query was executed. Clicking on the server names will open the sniffer for that server with the time-range selected as the first and last seen of the query.
Index Usage
Beyond the Overview page, the Index Usage monitor group is good starting point for identifying the presence of table scans. You should always try to keep these as low as possible by building indexes on searchable fields.
Although this screen does not relay information about specific queries, the monitor groups in Monyog read the MySQL Slow Query log do provide that information (covered in the next section). Once you have identified the problematic queries, you can create the appropriate indexes or rewrite the queries to use indexes.
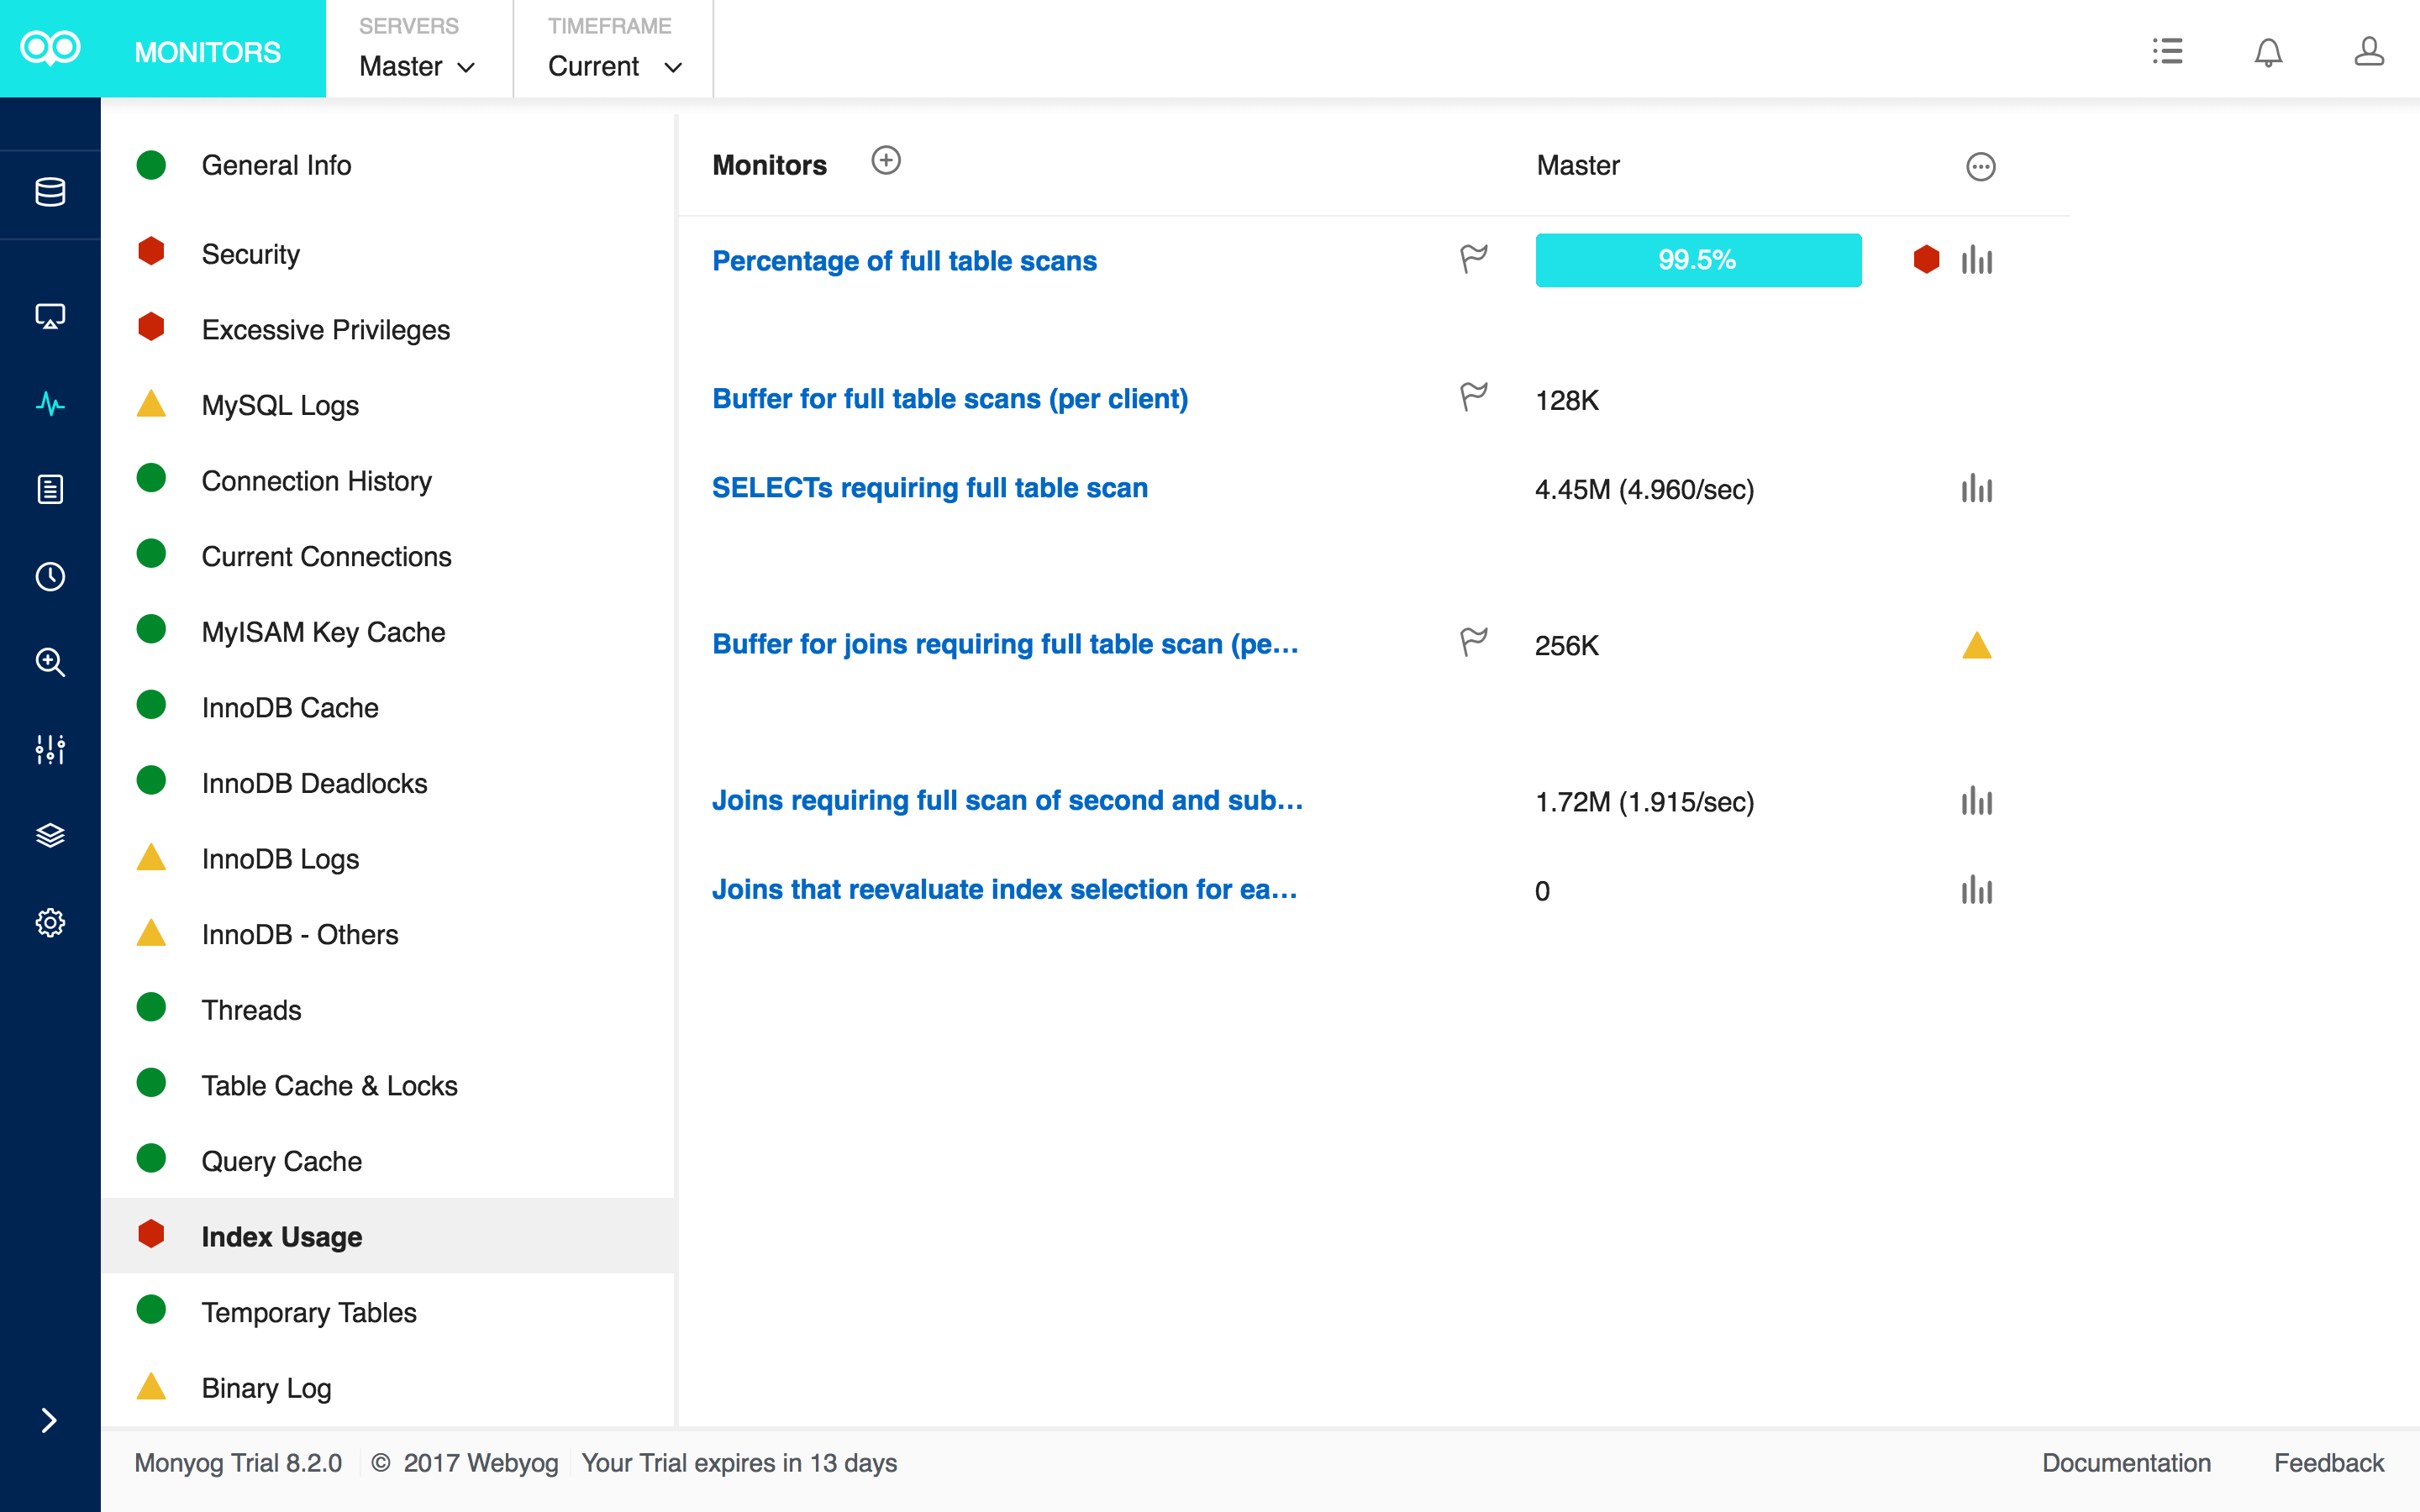
Monitors tab – Index usage
Examining the MySQL Slow Query Log
The MySQL slow query log is a log that MySQL sends slow, potentially problematic queries to. Generally the queries that are logged are those that take longer than a specified amount of time to execute or queries that do not properly hit indexes. Queries that do not use an index may not be slow if there are only a few hundred or few thousand records in the table(s) involved. But they are 'potentially slow' and should be identified if they access tables, which will continue to grow.
This logging functionality comes with MySQL but is turned off by default. You can check whether or not it’s turned on from the MySQL Logs screen.
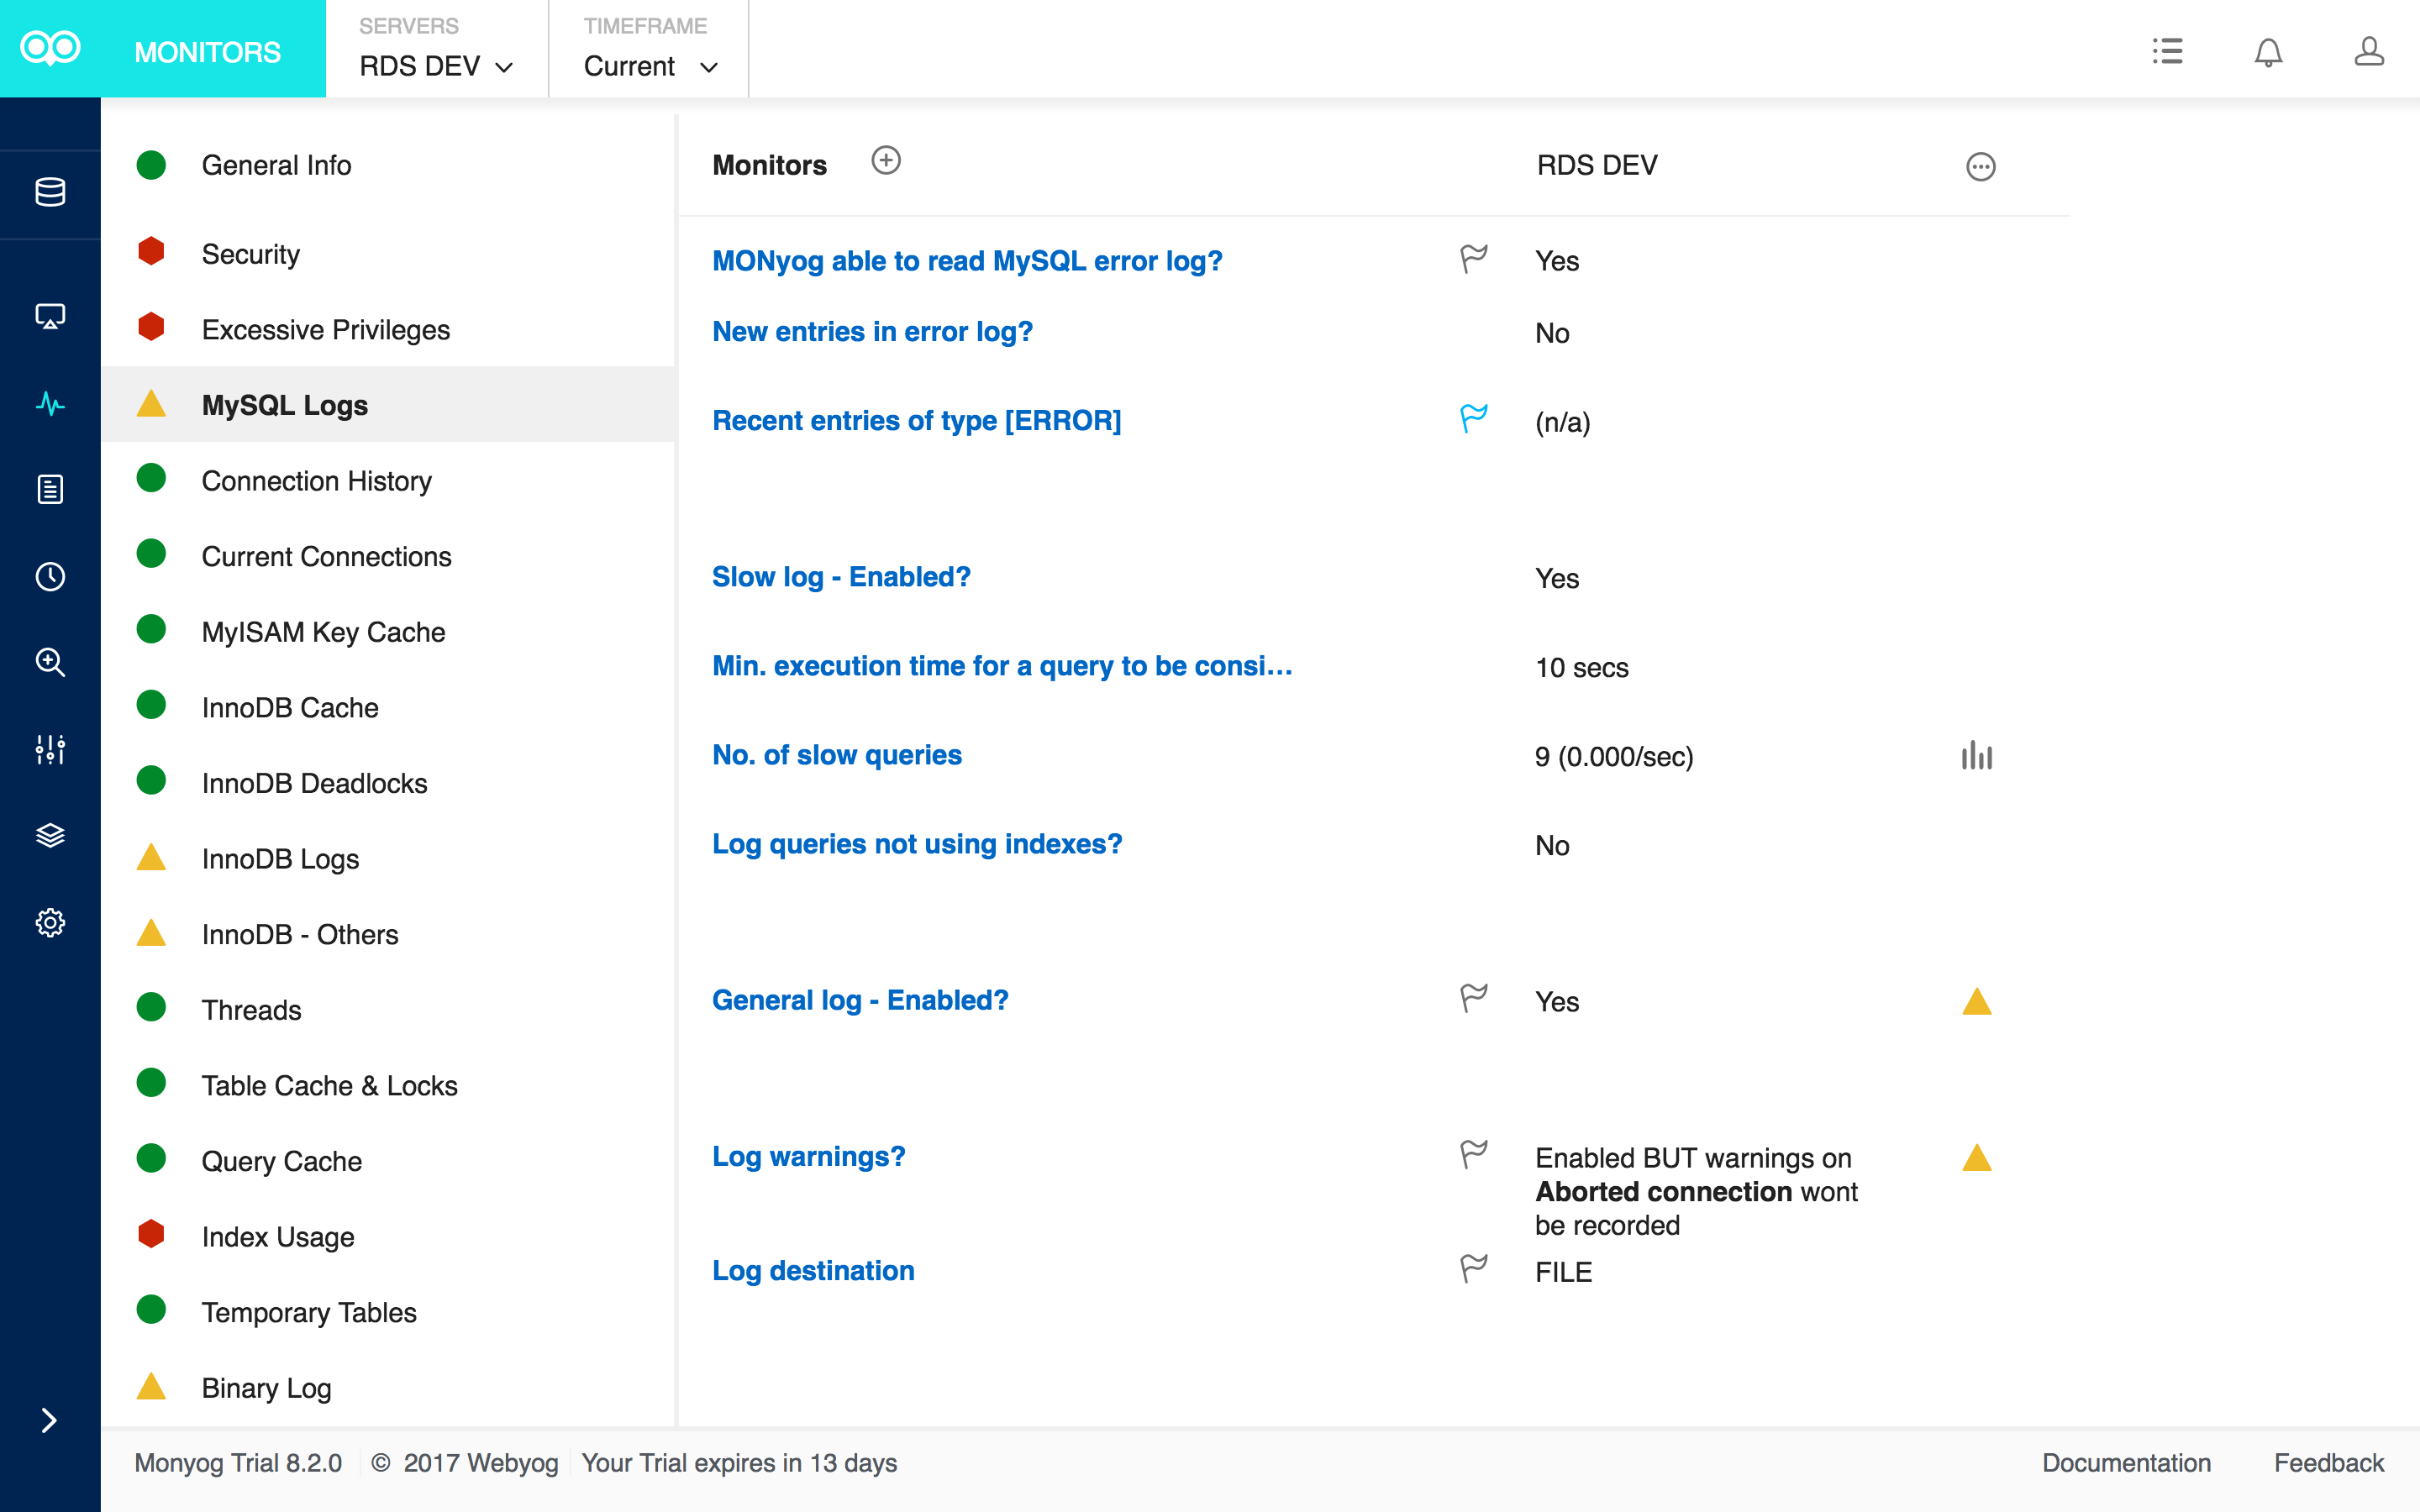
Monitors tab – MySQL logs
The No. of Slow Queries relays how many queries are taking longer than the Min. execution time for a query to be considered slow threshold (based on the MySQL long_query_time variable). On the right, there is a chart icon that, when clicked, opens the TREND VALUES chart.
Selecting “History” from the TIMEFRAME dropdown at the top of the Monitors page allows us to group trend data by minutes, hours, days, weeks, months, or years. More precise timeframes help to more accurately tie the offending query to the slowdown event:
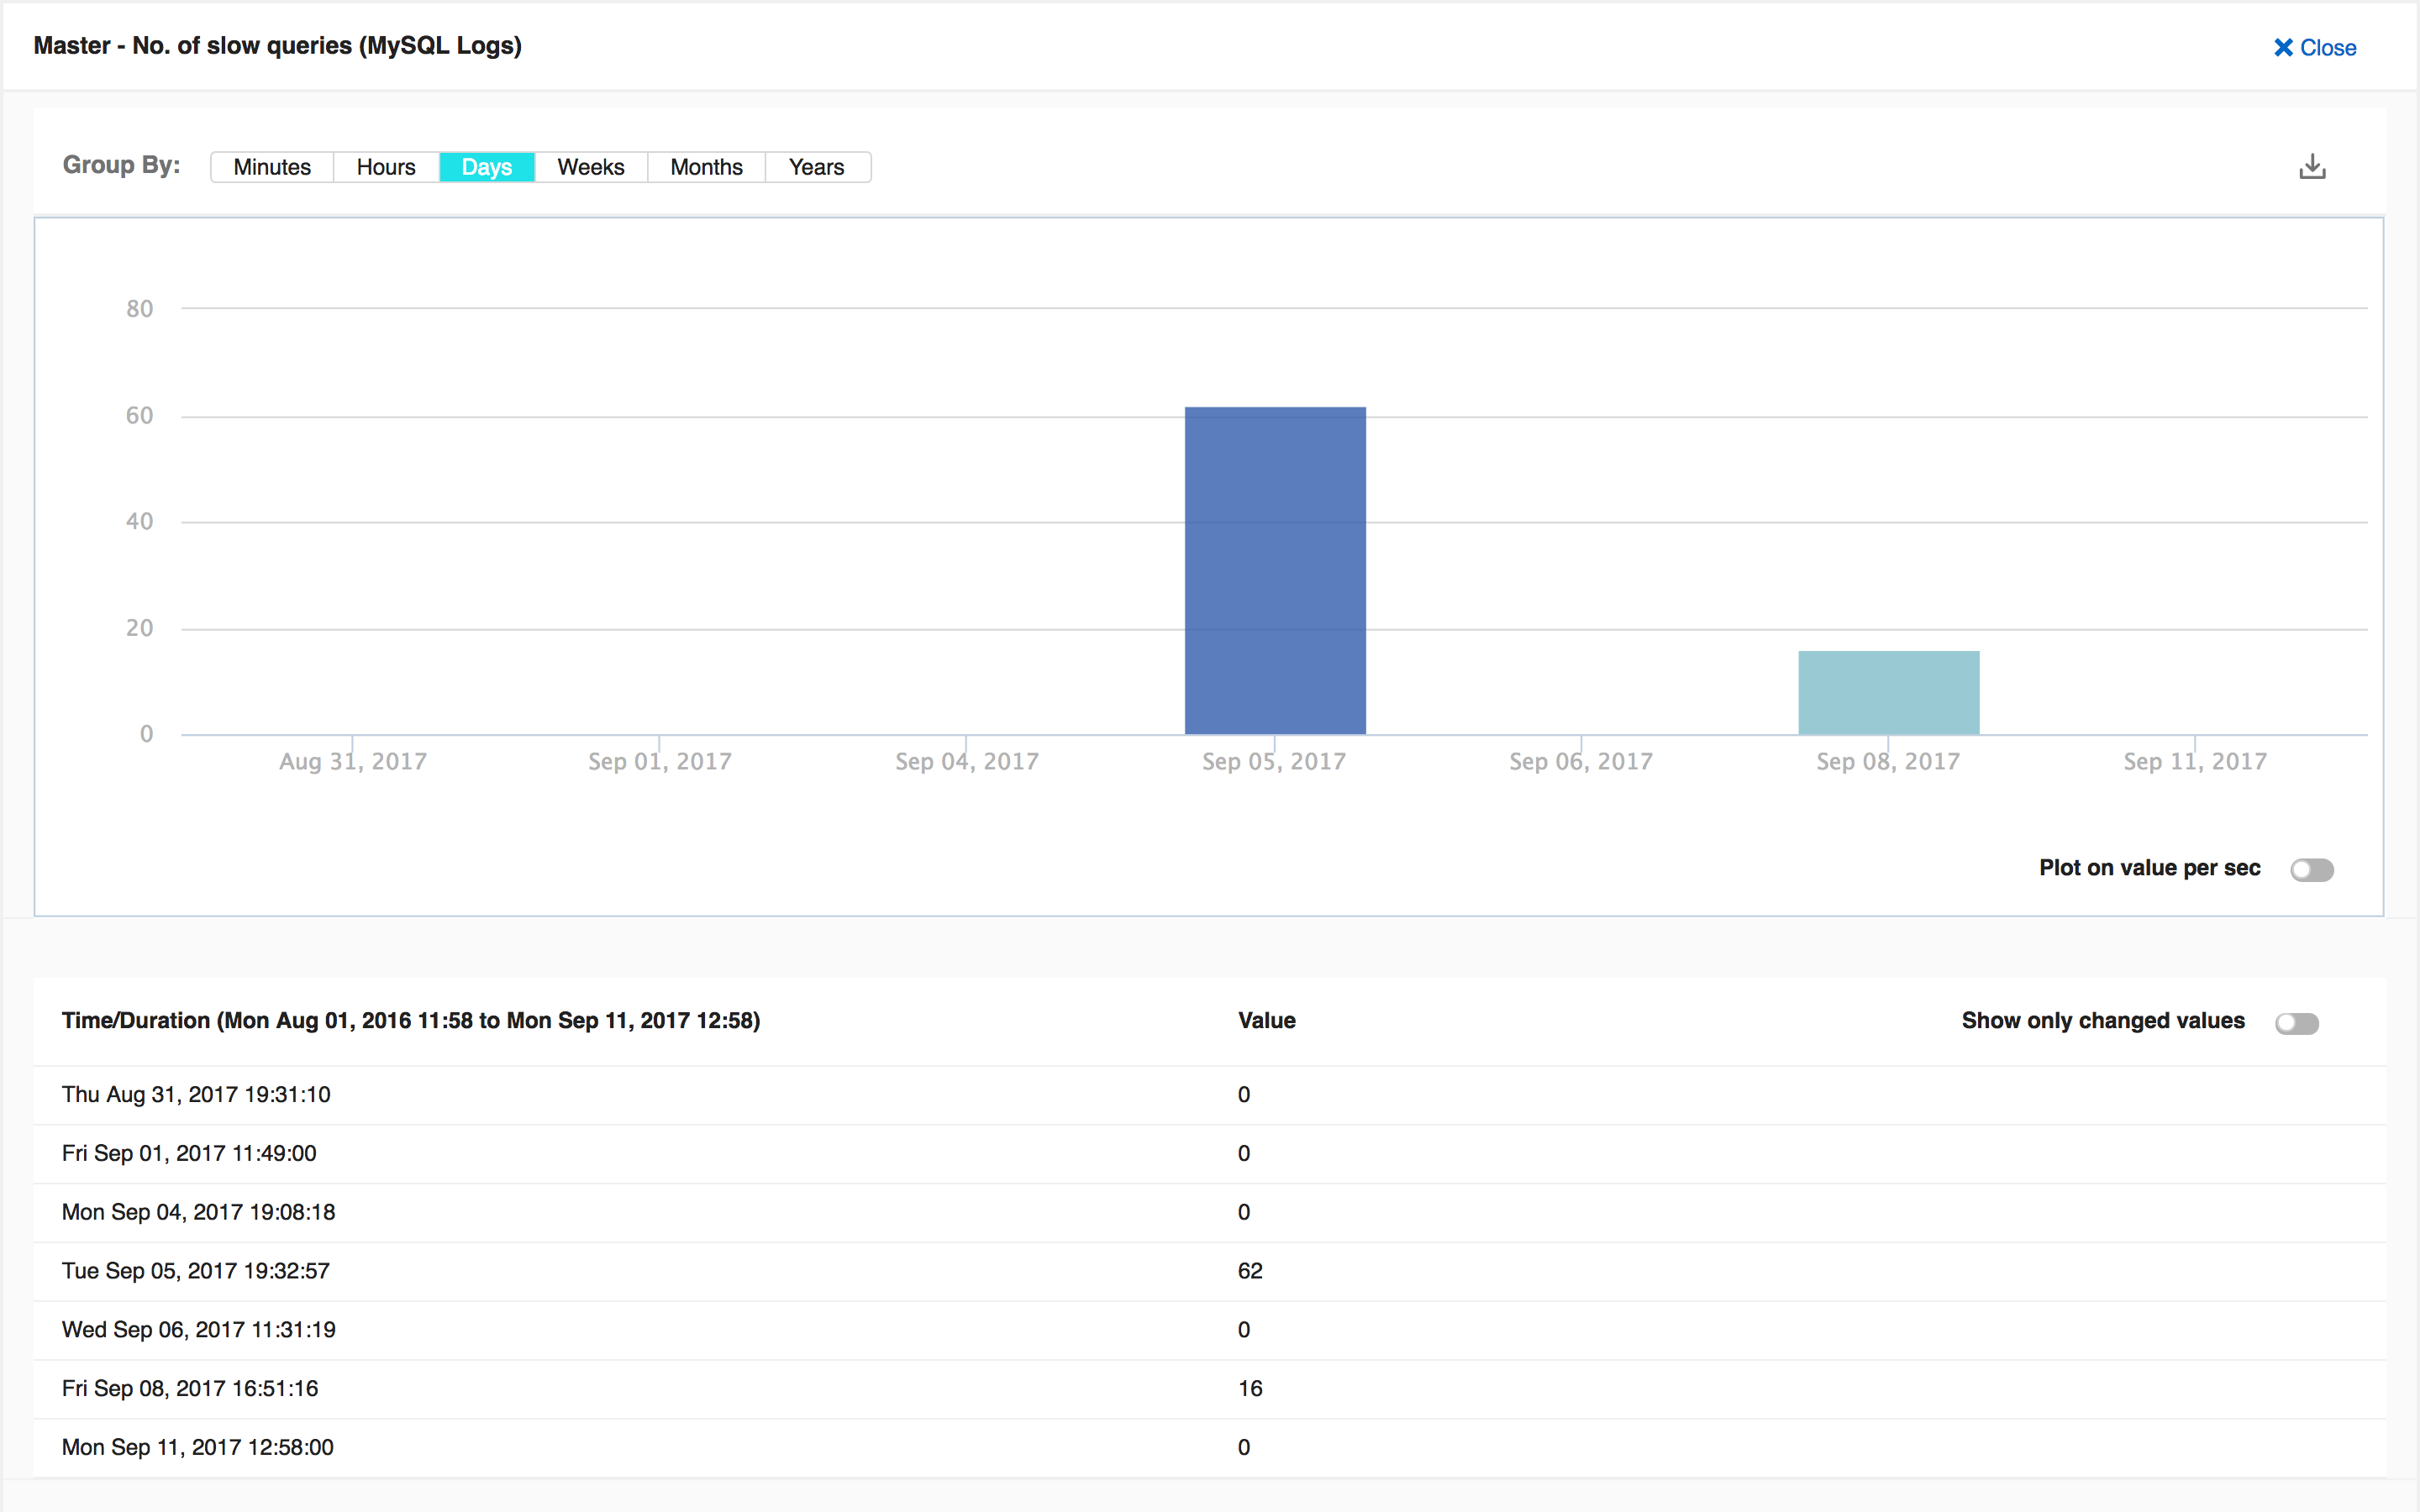
Monitors tab – No. of Slow Queries
Thread Monitors
Accessible from the left-hand button bar (refer to the highlighted icon below), the Threads page shows you the number of threads currently being executed by MySQL fetched using the query SHOW FULL PROCESSLIST. Each query sent to MySQL is executed in a thread. The Threads feature should be used to check which queries are being executed presently. It gives you a general sense of what is keeping your server busy at that moment.
While not the best feature for monitoring queries executed over a period of time (that would be the Query Analyzer presented in the next section), it can nonetheless be employed to locate runaway processes. Under the Actions heading on the far-right, there are buttons to kill each thread:
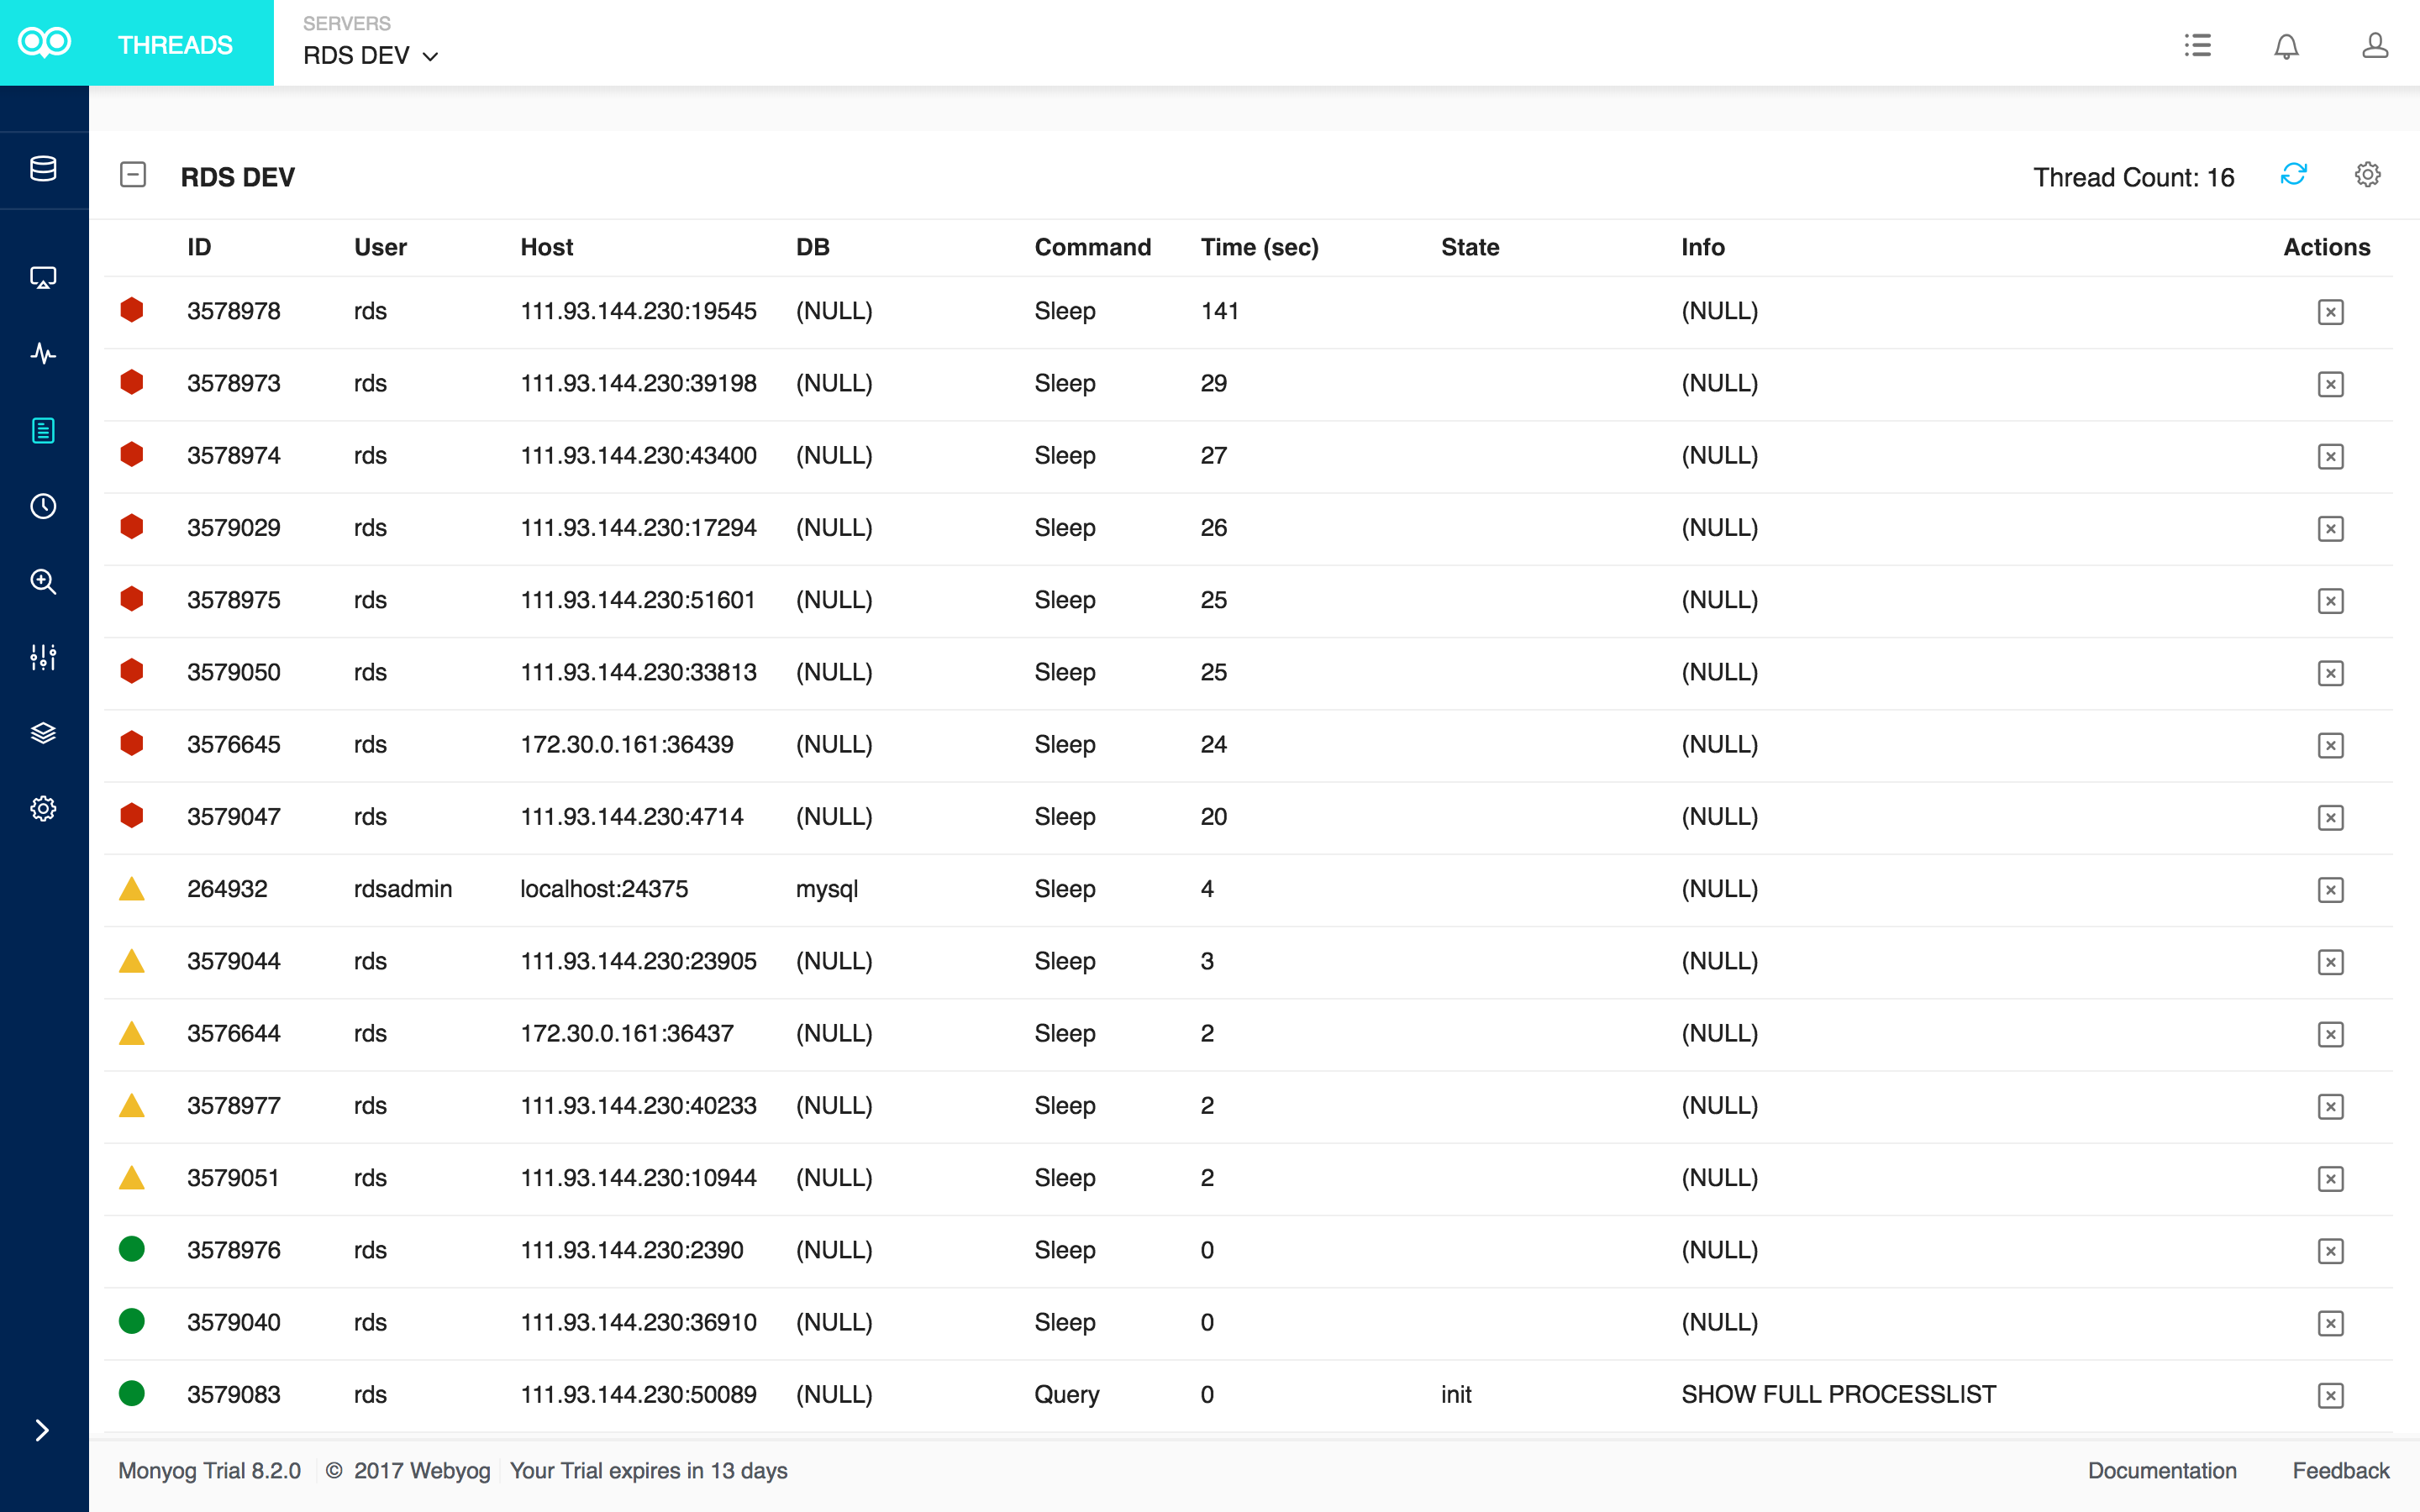
Threads
Real-time Query Monitoring
Monyog also gives us the ability to monitor MySQL servers via Real-time monitoring. It may also provide invaluable information on poorly performing queries. To show performance metrics:
- Click the (Real-time) Clock icon on the left-hand side of the screen.
- On the next screen:
- Select a server to monitor.
- You may then choose to start a new session or load a saved one.
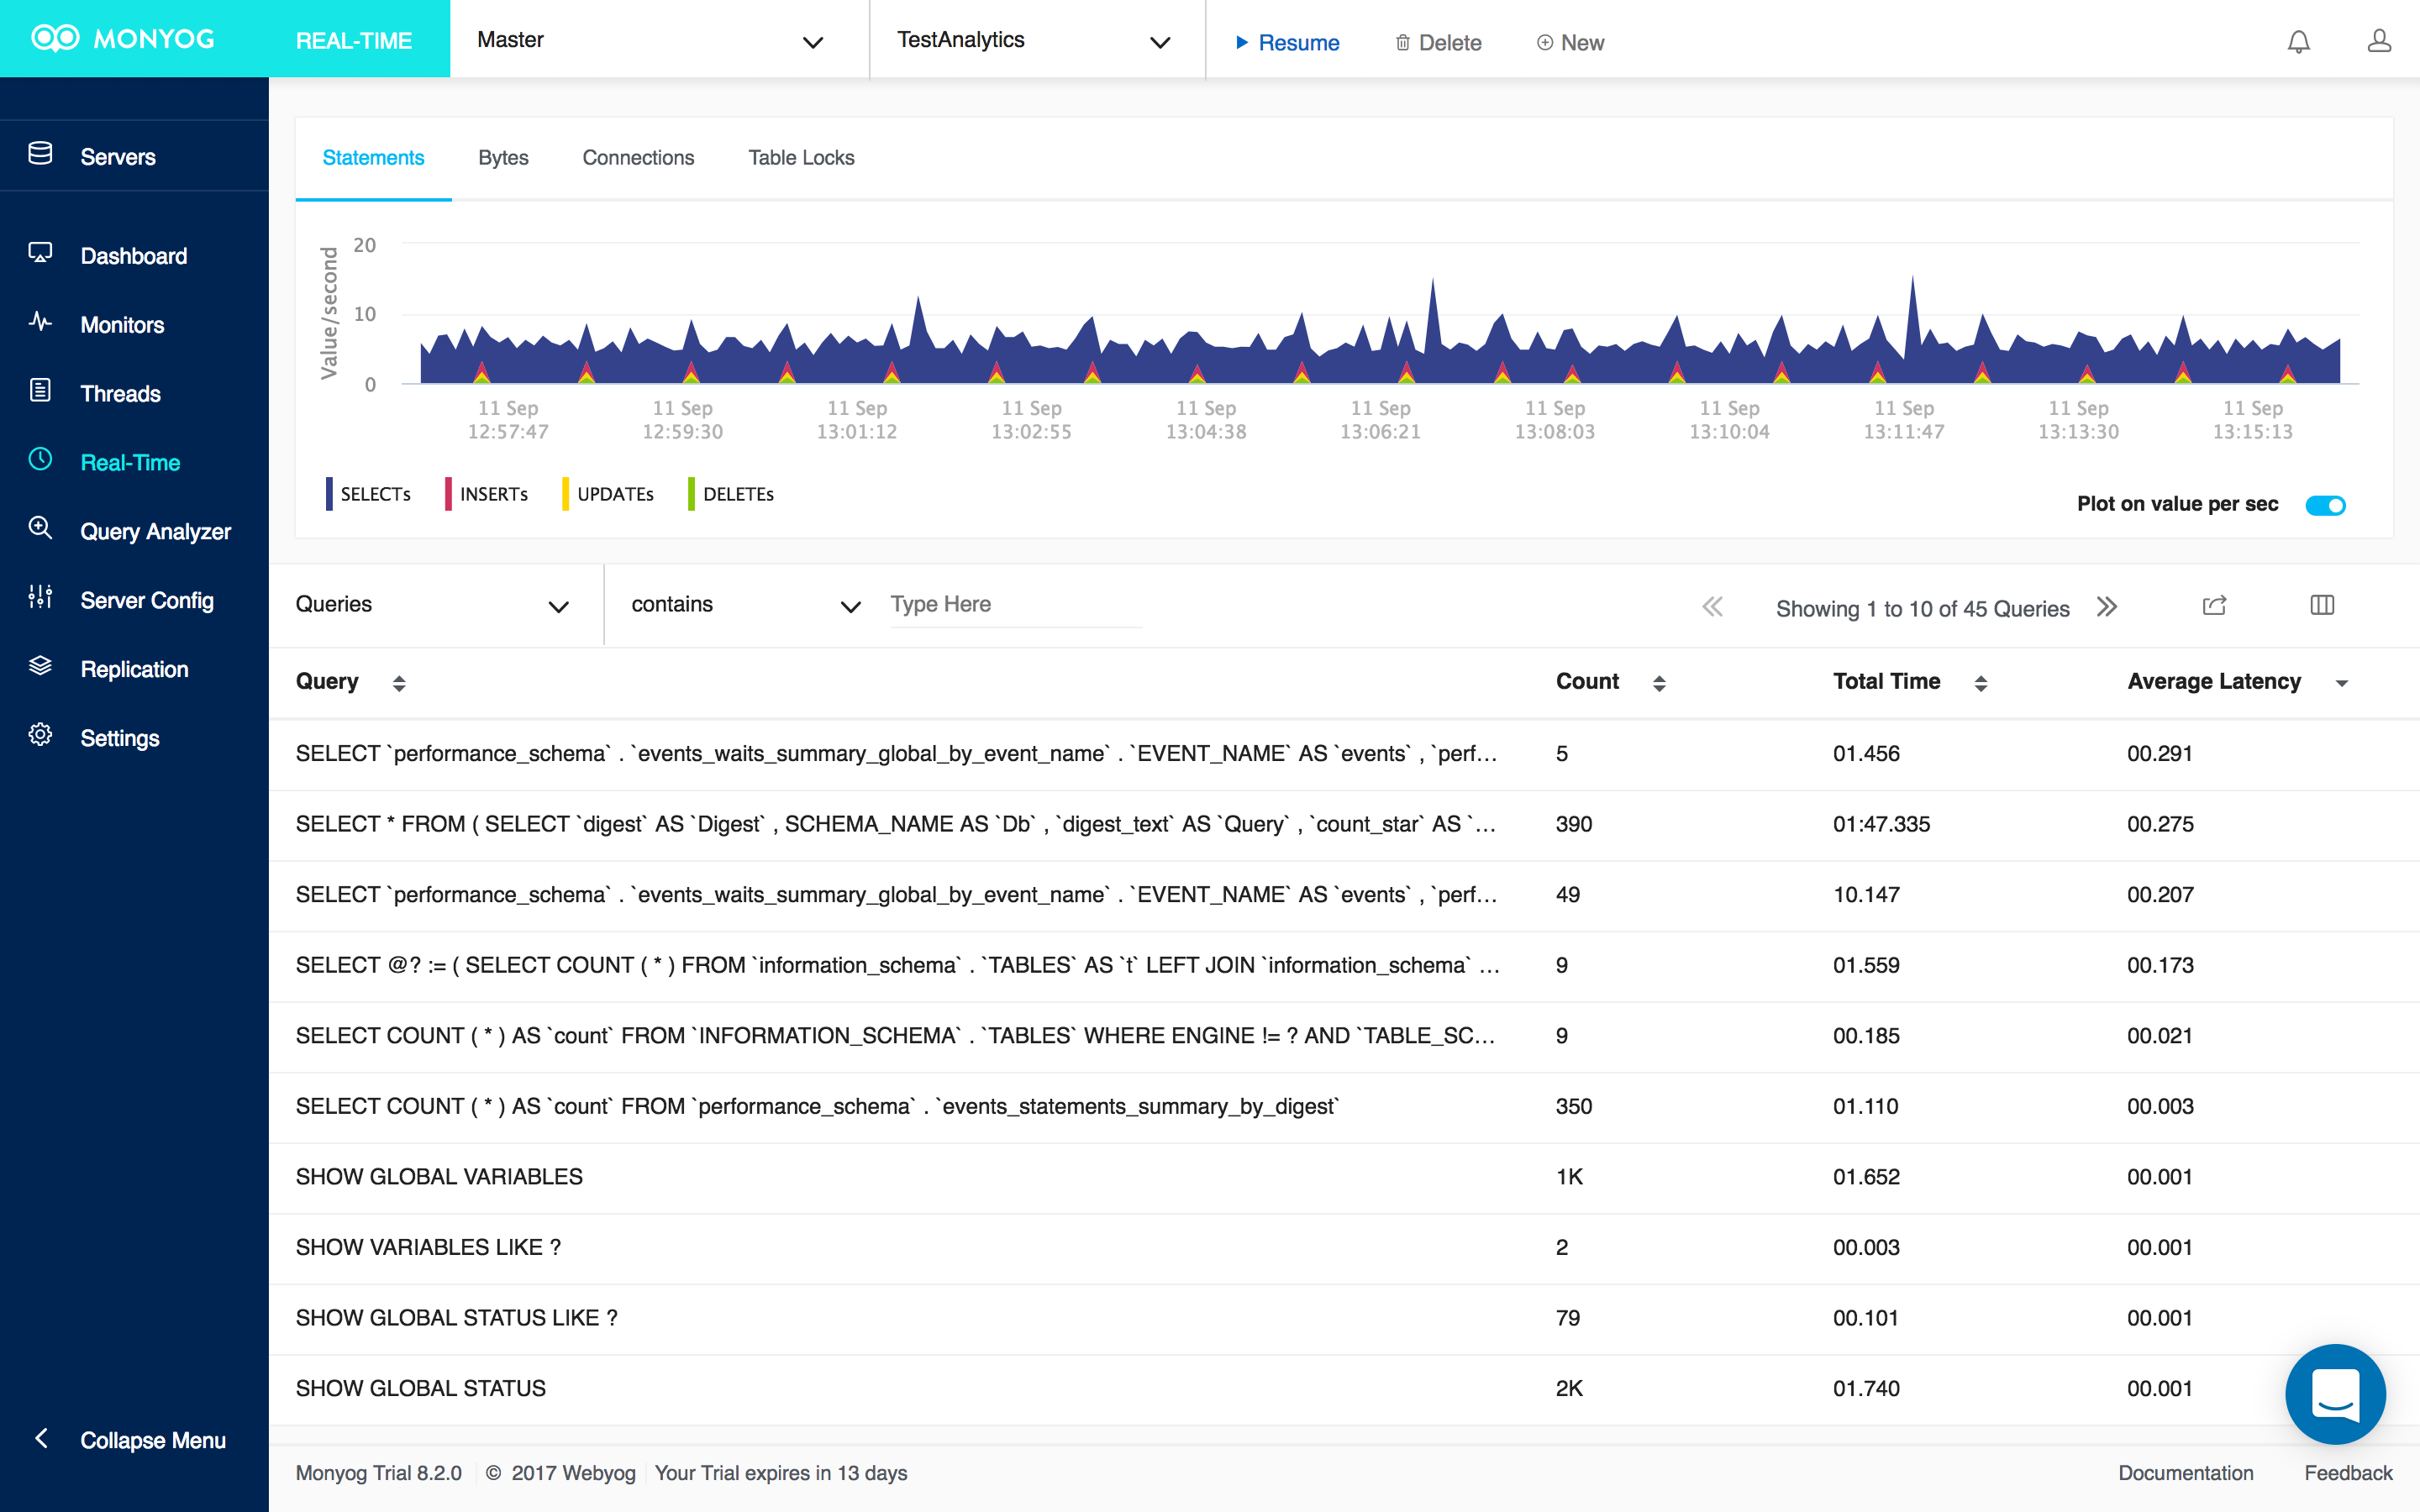
Realtime MySQL Monitor
Like the Overview page, Monyog’s Query Analyzer screen also displays The Average Latency and the Total Time taken by each query to execute. In addition, you’ll find the user and host who executed the query.
You can delve deeper into a query’s mechanics via the EXPLAIN command by clicking on the query and selecting the Explain tab on the Query Details screen:
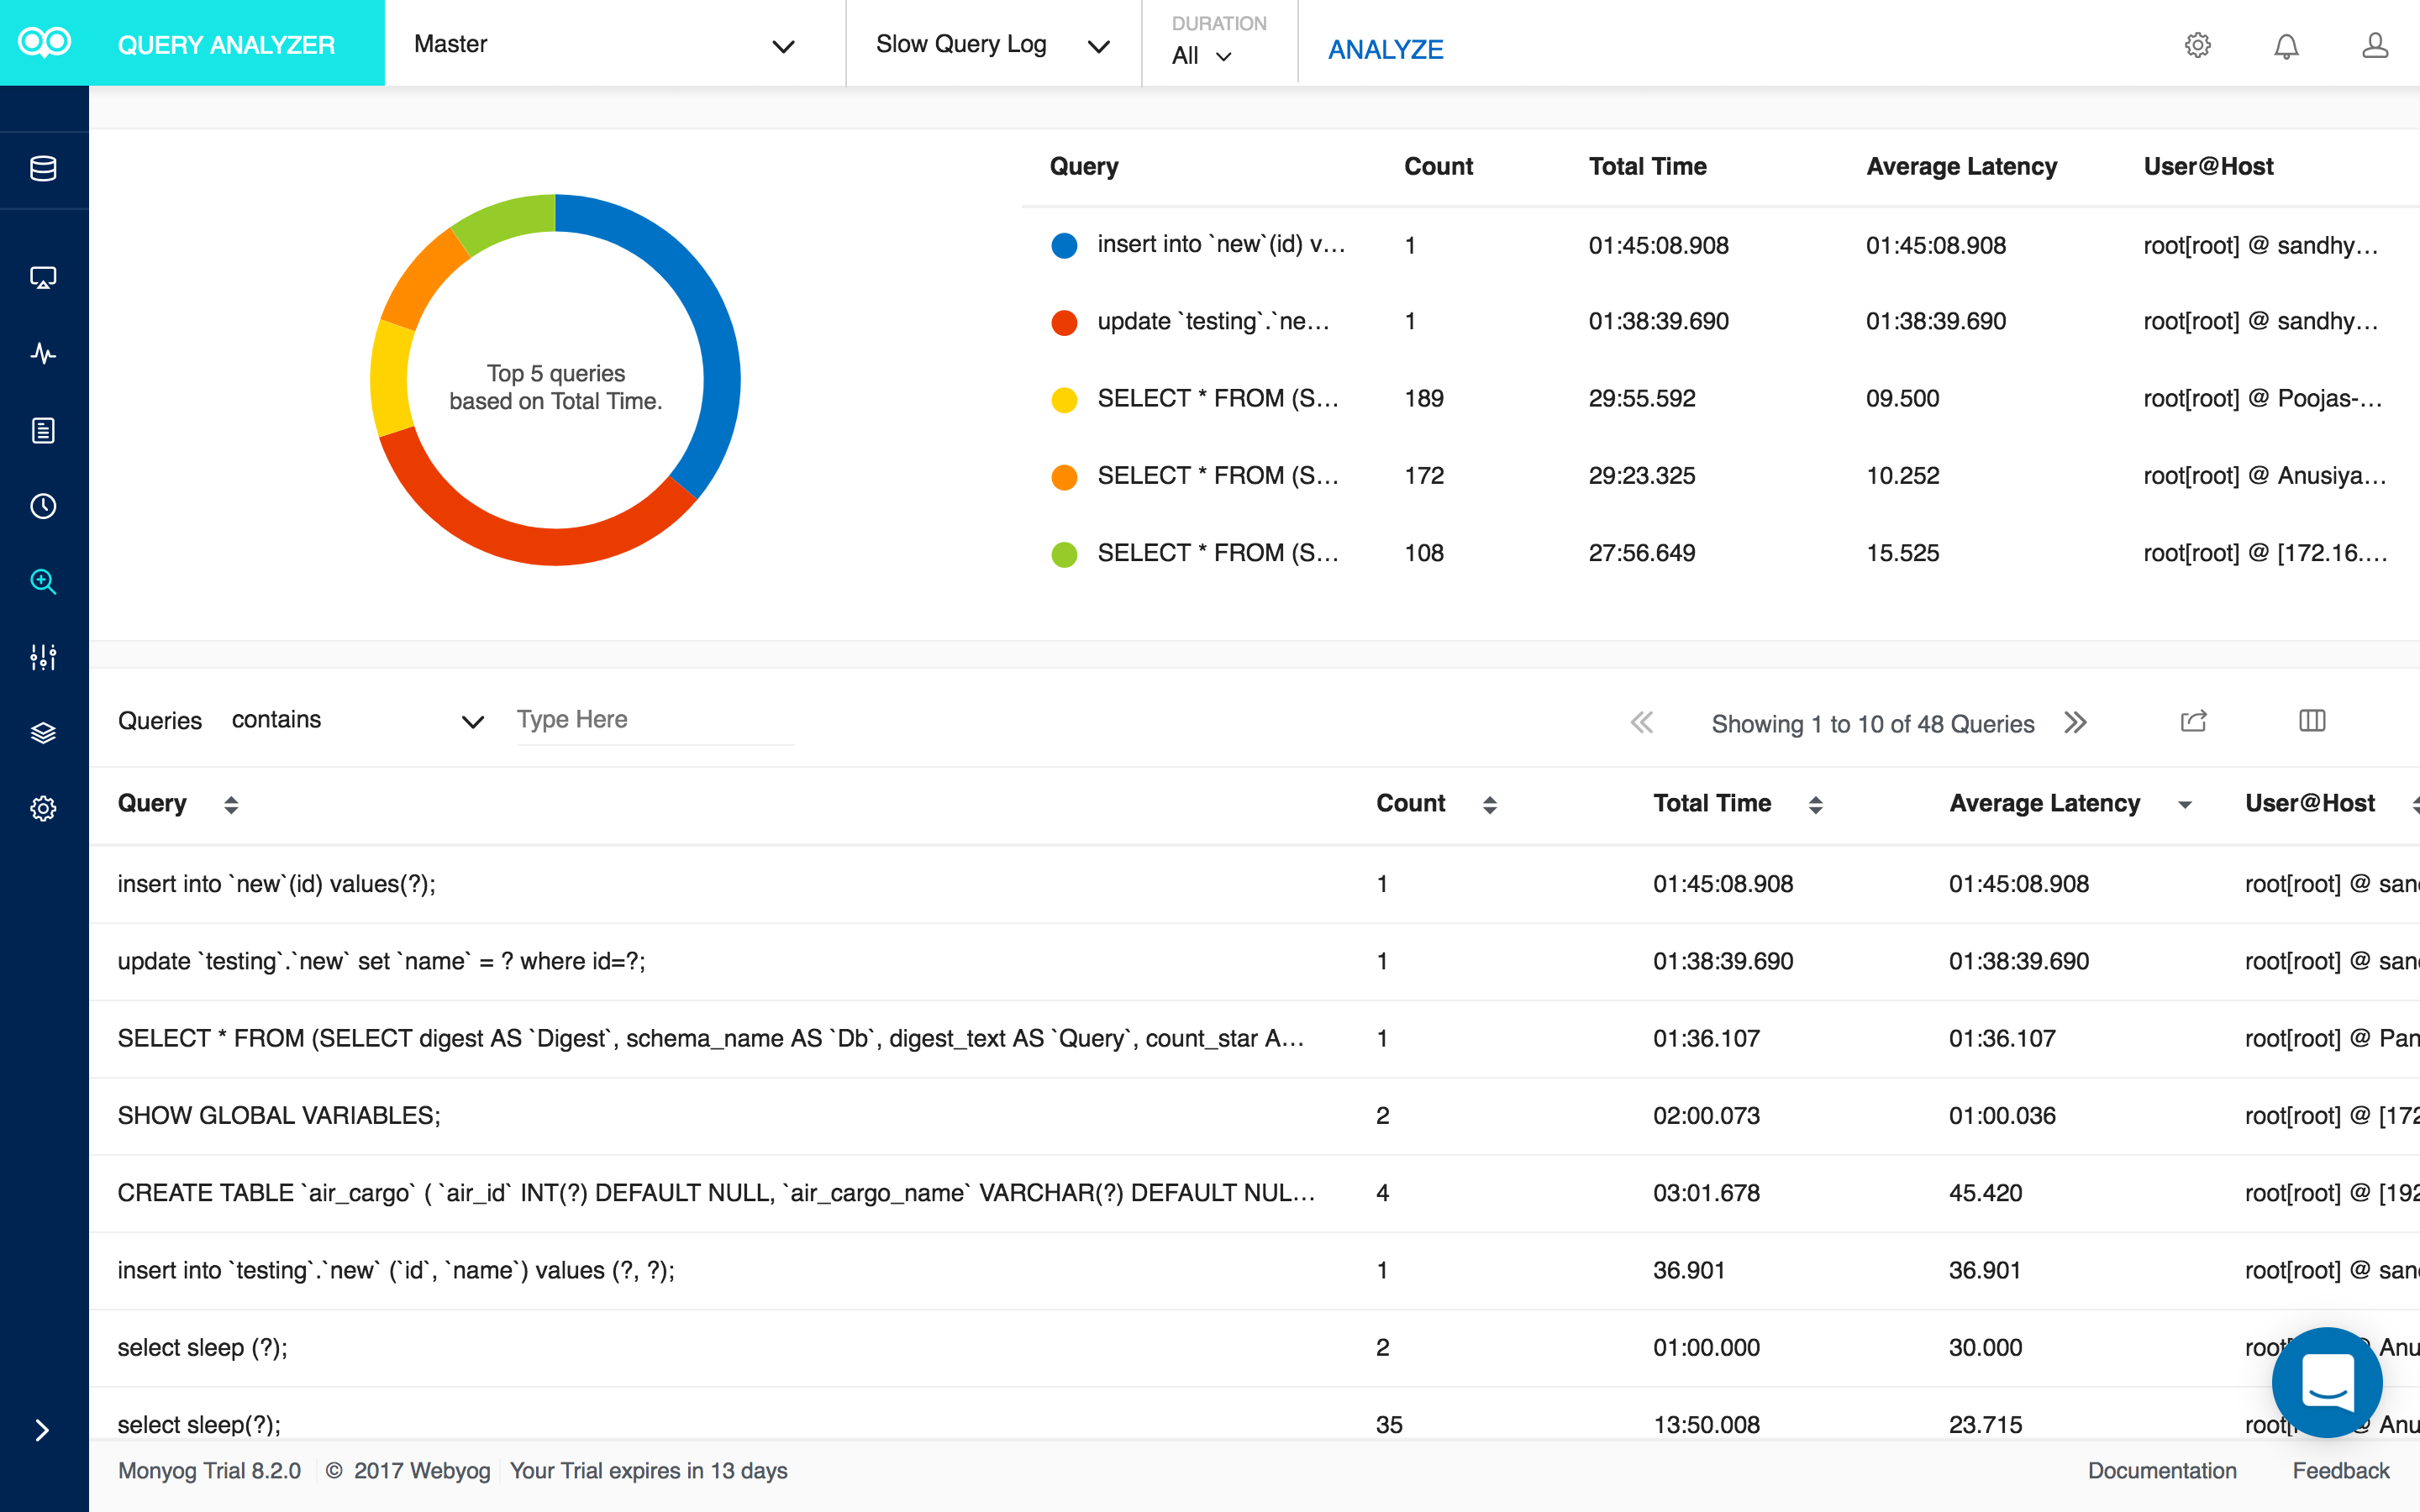
Query Analyzer
The Explain Result’s Type column describes how tables are joined. In the above Explain Result, we see a type of “ALL” in combination with an absence of keys. That indicates that a full table scan is being done for each combination of rows from the previous tables. This is normally not good if the table is the first table not marked “const”, and usually very bad in all other cases. You can usually avoid ALL by adding indexes that enable row retrieval from the table based on constant values or column values from earlier tables.
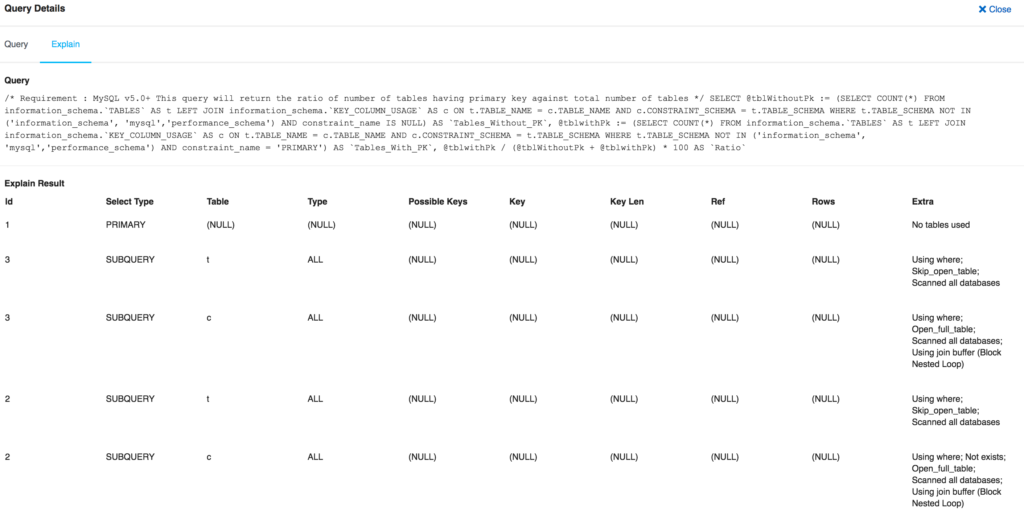
MySQL queries details screen
“Performance Schema” Mode for Data Collection
The latest update of Monyog brings new easier ways to find problem SQL in Real-Time, including “sniffer” based Query Analyser using Performance Schema. It allows you to view the success/failure status of every query executed and also the number of ‘full table scans’ for queries in a single glance.
Monyog's query sniffer is a functionality that records a 'pseudo server log' and stores it in the Monyog embedded database.
The Sniffing Mode is set on the ADVANCED tab of the server properties dialog.
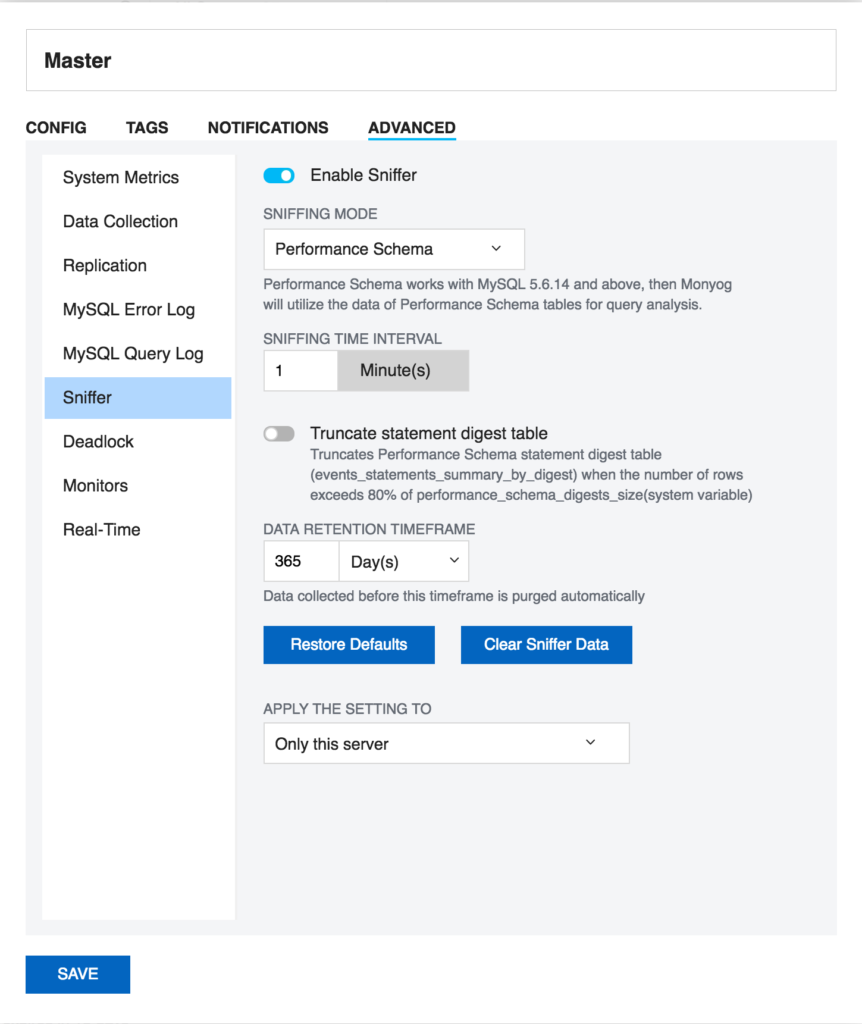
Server properties dialog
With 'Performance Schema Sniffer' enabled on the Query Analyzer screen, you can include many additional columns to the analysis, including a count of Full Table Scans.
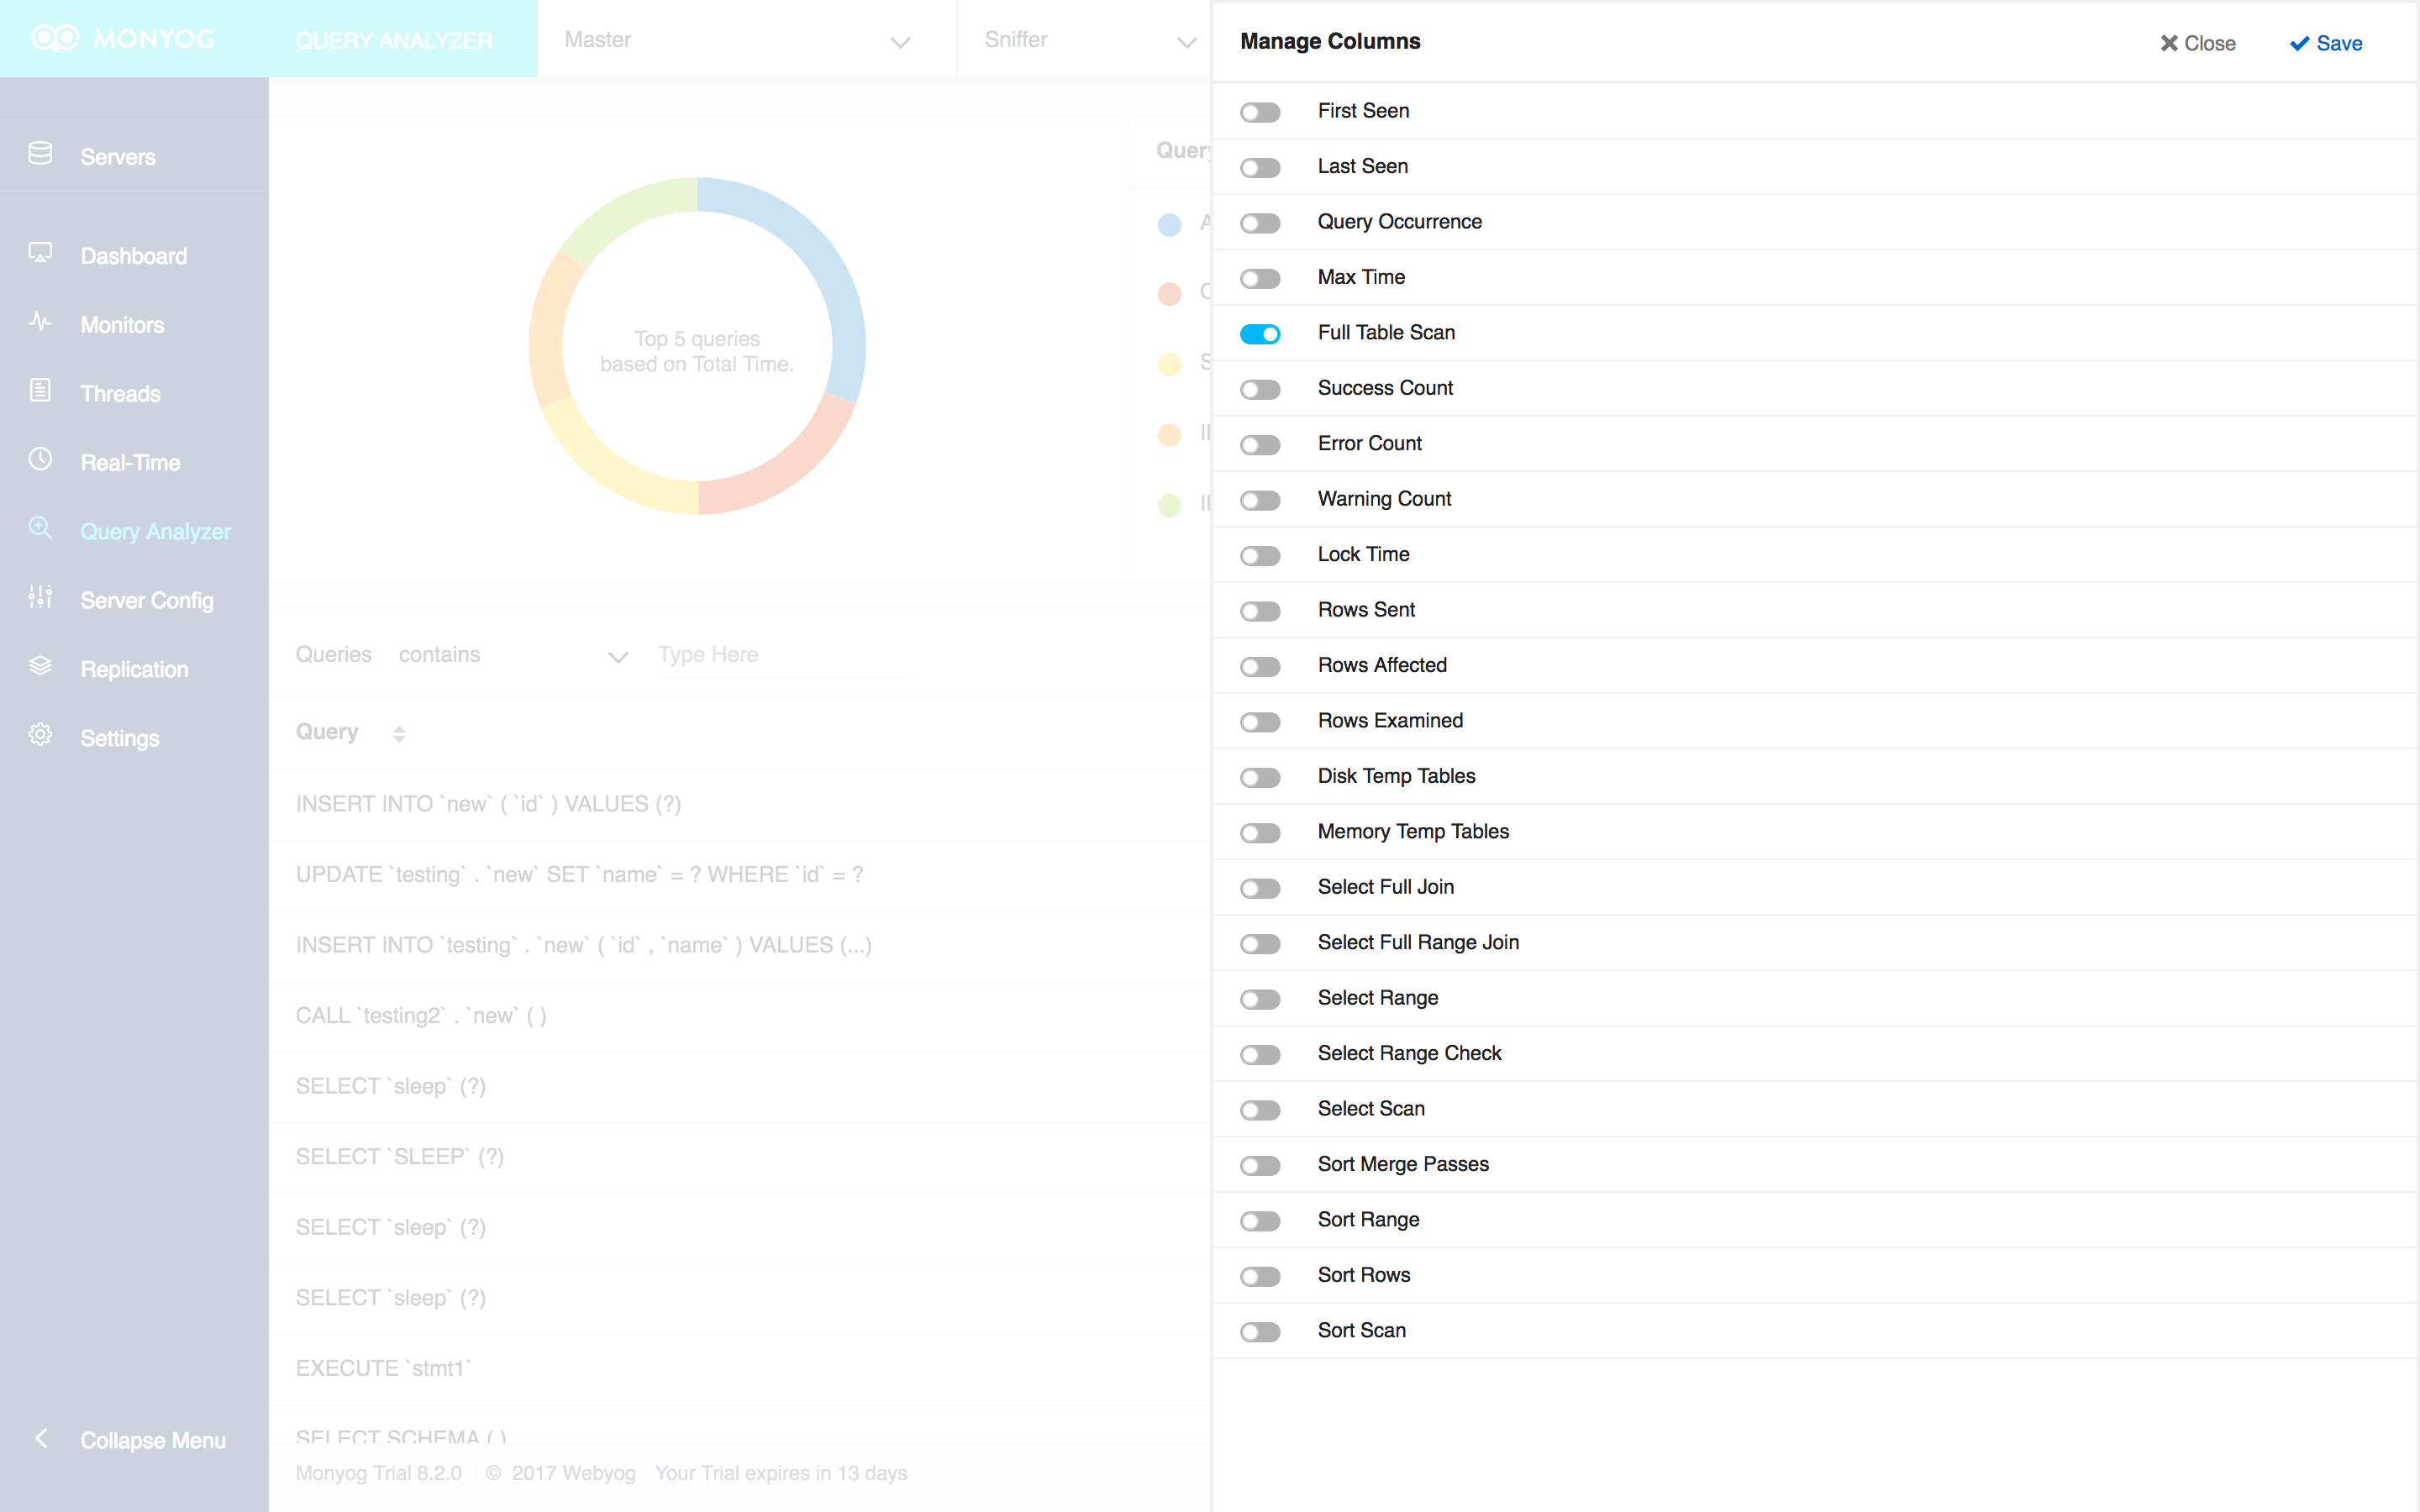
Query Analyzer screen with manage columns panel
Here is the Query Analyzer screen in Sniffer mode with the Full Table Scan column added:
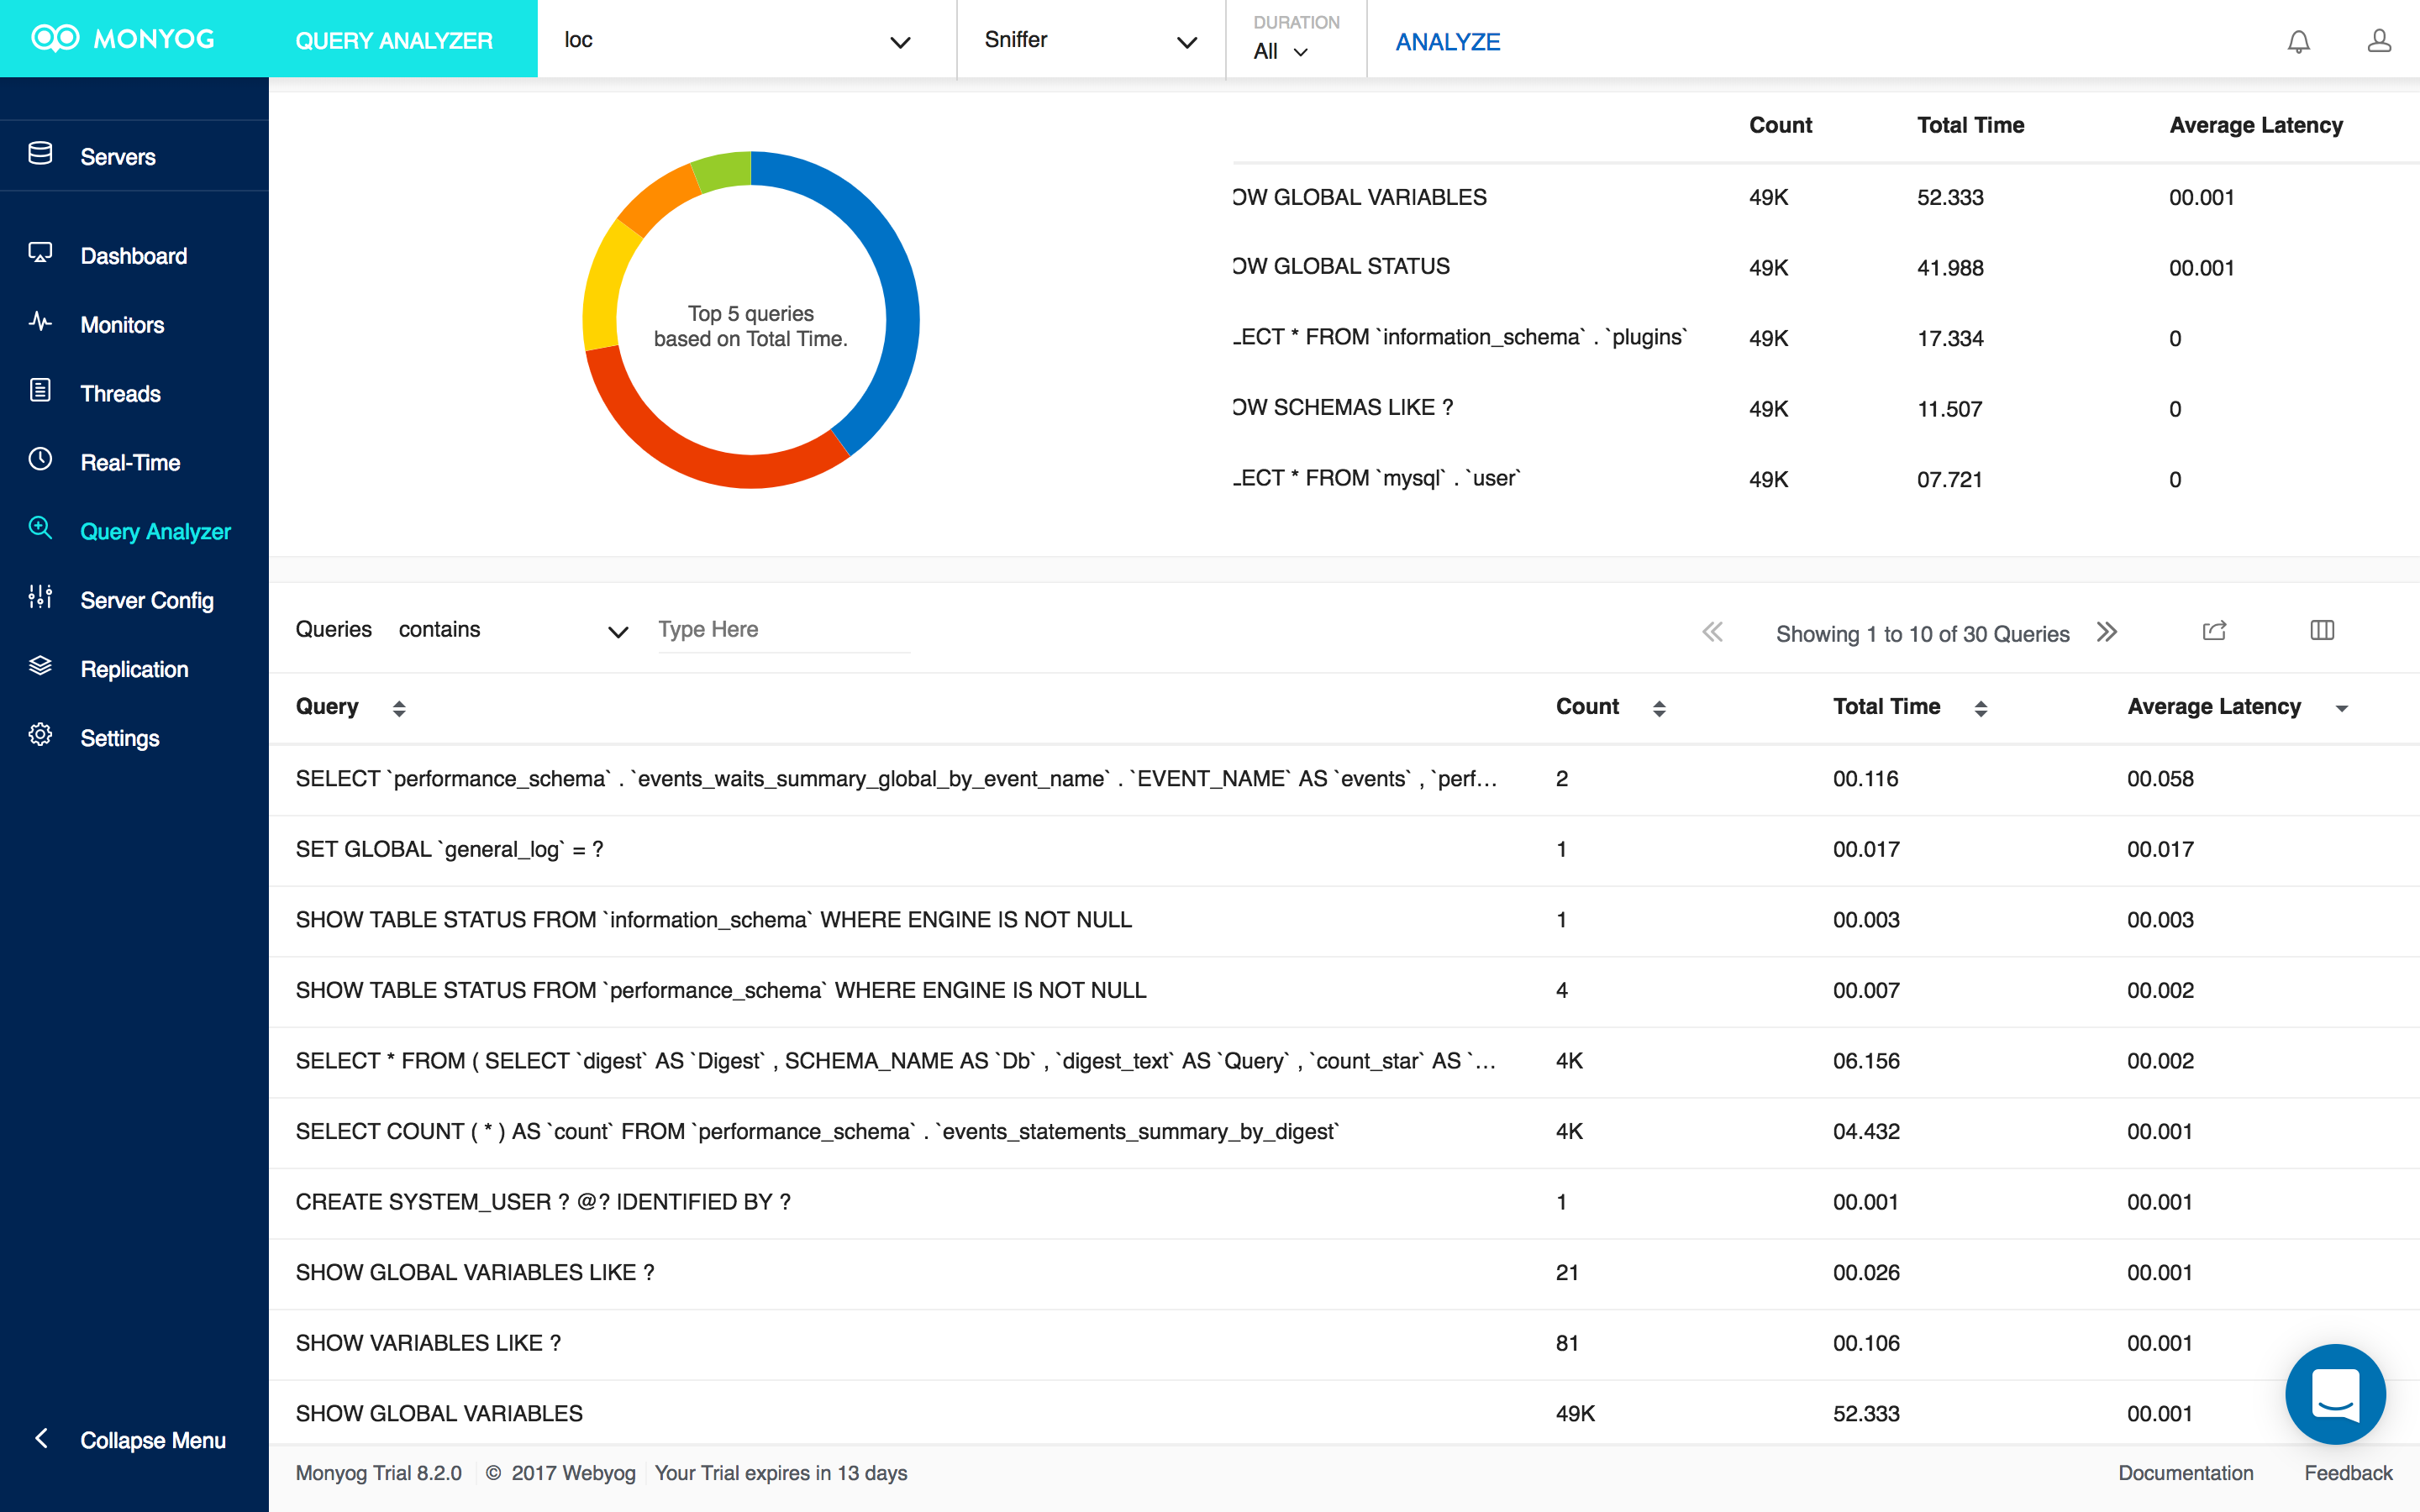
Query analyzer – sniffer
A Few More Tips…
Some other ideas that may help fix CPU problems:
- Run SHOW FULL PROCESSLIST while the CPU load is high. This will show you any queries that are currently running or in the queue to run and what it’s doing.
- Keep an eye on things like your buffer sizes, table cache, query cache and innodb_buffer_pool_size (if you're using innodb tables) as all of these memory allocations can adversely affect query performance which can cause MySQL to consume CPU cycles.
- If you are using WordPress, its plugins are notorious for doing monstrous queries.
- Try modifying the innodb_buffer_pool_size parameter. It should be set to at least the size of the file ibdata1, which is located in /var/lib/mysql. InnoDB works much more efficiently when it is able to be resident in memory. This may be impractical in some situations because the ibdata1 can be quite large. The innodb_log_buffer_size parameter should be 25% of the size of innodb_buffer_pool_size.
- Give MySQL at least half of available server memory if possible.
Conclusion
By using the Monyog features described in this blog, you should be able to identify the queries and/or processes that are causing system bottlenecks. You can then make the changes to improve the performance by modifying the query, Indexes and database design, based on Monyog’s Advice text.
SQL query-performance tuning is as much art as science, and is thought by some to belong to the realm of application development rather than Database Administration. Under that assumption, the goal of DBAs would be to identify those slow-running or CPU-intensive queries, gather evidence and then work with developers to find ways of improving them.
Monyog is an agentless MySQL monitoring tool that can uncover key MySQL performance insights. You can download a 14-day free trial here.