Amazon Web Services (AWS) is a cloud platform that offers a wide variety of services including computing power, database storage, content delivery and other functionality that targets businesses of all sizes. One of their database solutions includes the Amazon Relational Database Service. Amazon RDS includes a number of popular RDBMSes, including Amazon Aurora, PostgreSQL, MySQL, MariaDB, Oracle, and Microsoft SQL Server, as well as tools to manage your databases and monitor their performance.
Despite the wide range of metrics available within the Amazon RDS console, there are some very good reasons for using your own monitoring tool(s) instead or in addition to those offered by Amazon RDS. For example, familiarity with your own tool(s) or access to features that Amazon RDS does not provide would constitute two persuasive reasons for employing a local tool.
With traditional software monitoring platforms such as Monyog still enjoying widespread usage on cloud-based databases, vendors have been quick to accommodate cloud DBaaS platforms by adding new support and features. Case in point, Monyog version 8.1.0 introduced the RDS/Aurora OS Monitoring feature to make use of Amazon’s CloudWatch API and utilize the different OS metrics available with the API to fetch and display data.
In this blog, we will explore how to monitor MySQL Performance Metrics using both the Amazon monitoring tools as well as the latest version of Monyog in order to compare the strengths of each.
Amazon RDS Metrics
Amazon’s RDS database platform provides statistics and advice about many types of metrics including:
- High CPU or RAM consumption
- Disk space consumption
- Network traffic
- Database connections
- IOPS (input output operations per second) metrics
AWS provides both automated and manual tools that you can use to monitor your RDS database(s). This setup allows you to automate monitoring tasks as much as possible while leaving some for you to manage as you see fit.
These tools are spread across several dashboards including Amazon RDS, CloudWatch, AWS Trusted Advisor and other AWS console dashboards. Each targets different types of metrics about resource utilization and performance as well as services like alarms and troubleshooting. We’ll be focussing on CloudWatch and the Amazon RDS here.
Monitoring with Amazon CloudWatch
Amazon CloudWatch collects and processes raw data from Amazon RDS into readable, near real-time metrics. Historical information is stored for a period of two weeks, so that you can gain a better perspective on how your RDS instance is performing over time.
The CloudWatch console is located at https://console.aws.amazon.com/cloudwatch/. From there, you can change the region and view RDS metrics by choosing Metrics in the navigation pane, followed by the RDS metric namespace. RDS metrics are divided by:
- Per-Database Metrics
- By Database Engine
- By Database Class
- Across All Databases

RDS Cloud Metrics
Clicking on a metric type shows all of the applicable metrics for that type.
Each metric has a checkbox on the left-hand side that, when checked, adds that metric to the displayed graphs:
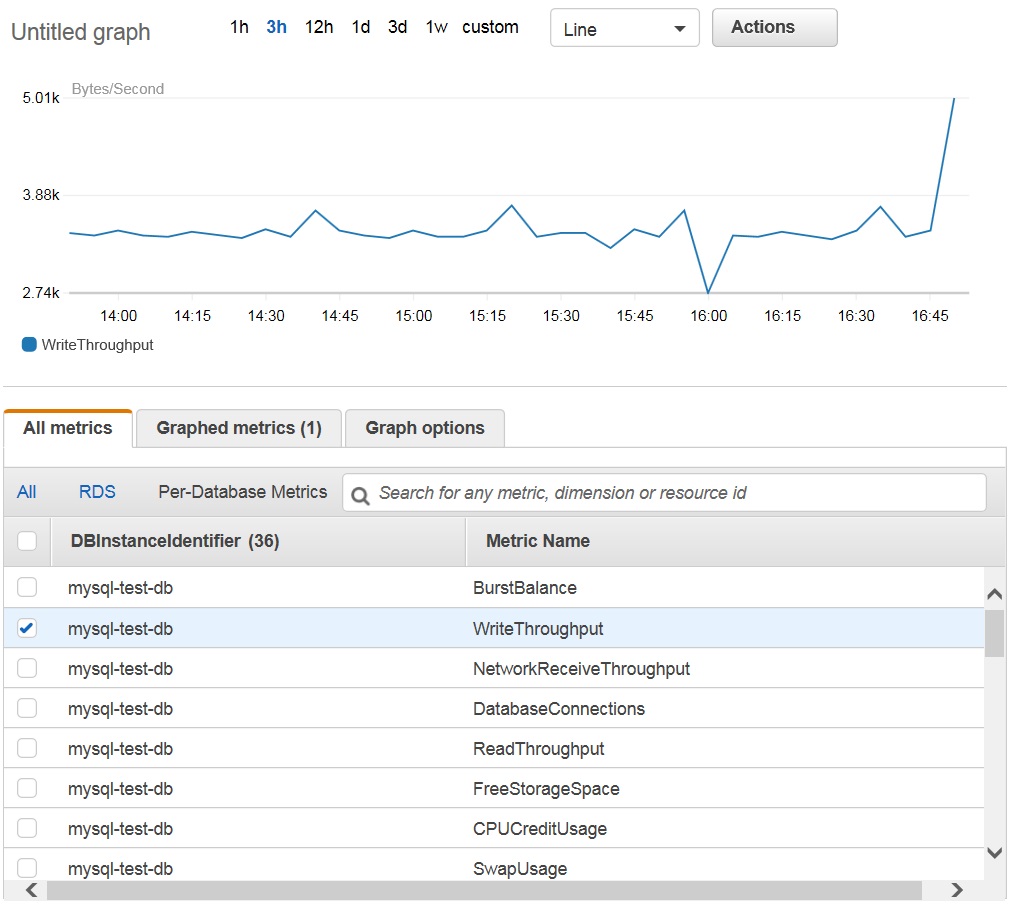
RDS CloudWatch WriteThroughput
CloudWatch metrics may also be viewed using the AWS Command Line Interface (CLI). It’s a unified tool to manage your AWS services from one place. The one tool may be utilized to download, configure, and control multiple AWS services from the command line and automate them through scripts.
The AWS CLI is built on top of the AWS SDK for Python. Once configured, you can start using all of the functionality provided by the AWS Management Console from your favorite terminal program, including Linux shells, the Windows command line, with the Amazon EC2 systems manager, and even remotely through a remote terminal such as PuTTY or SSH.
The following command lists all of the metrics for the AWS/RSD namespace:
aws cloudwatch list-metrics --namespace AWS/RDS
The Amazon RDS Dashboard
Amazon RDS provides metrics that pertain directly to the functioning of your DB instances and clusters. From the Amazon RDS Dashboard, you can monitor both database and operating system (OS) metrics.
Viewing DB and OS metrics for a DB instance using the Console
After a successful sign-in to the AWS Management Console, you can access the Amazon RDS console at https://console.aws.amazon.com/rds/. From there:
- In the navigation pane, choose DB Instances.
- Select the check box to the left of the DB cluster you need information about. Under Show Monitoring, choose the option for how you want to view your metrics from the following four choices:
- Show Multi-Graph View – Shows a summary of DB instance metrics available from Amazon CloudWatch. Each metric includes a graph showing the metric monitored over a specific time span.
- Show Single Graph View – Shows a single metric at a time with more detail. Each metric includes a graph showing the metric monitored over a specific time span.
- Show Latest Metrics View – Shows a summary of DB instance metrics without graphs.
- Enhanced Monitoring – Shows a summary of OS metrics available for a DB instance with Enhanced Monitoring enabled. Each metric includes a graph showing the metric monitored over a specific time span. (Enhanced Monitoring will be covered in more detail in the next section.)

RDS Show Monitoring Views
The time range of the metrics represented by the graphs may be selected via the Time Range dropdown. It’s available for every Dashboard except Enhanced Monitoring.
Graphs are divided into many pages that can be accessed via the page buttons. Moreover, the Show All button displays all graphs on one page.
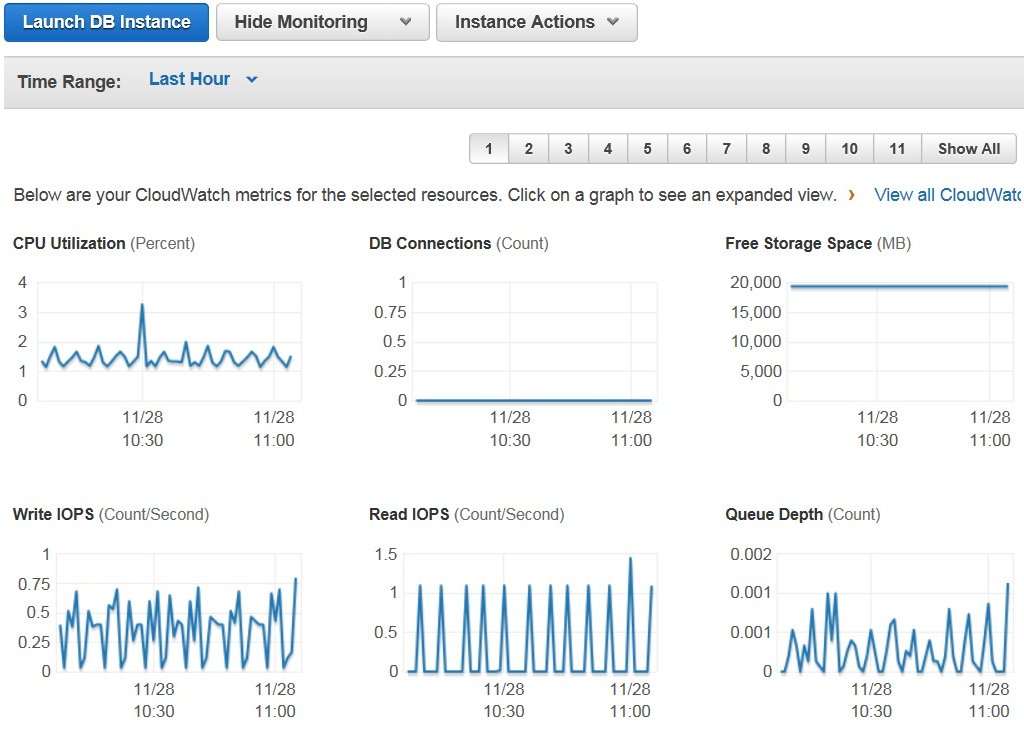
RDS Multi-graph View
Clicking on any graph brings up a more detailed view of that graph:
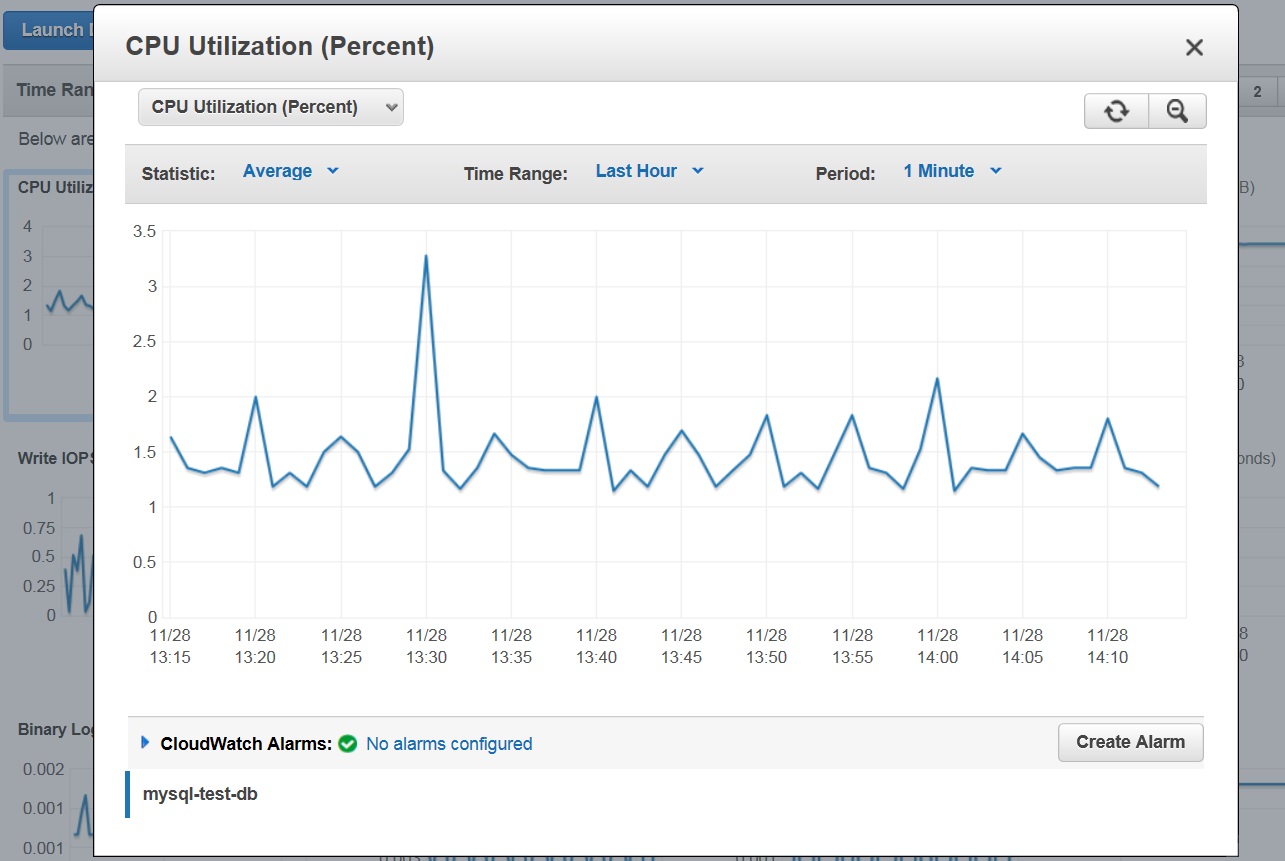
RDS detailed graph view
You can apply metric-specific filters on this screen as well as create applicable alarms.
Enhanced Monitoring
To gather and analyze metrics for your DB instance and its underlying operating system (OS) in real time, you can view Enhanced Monitoring metrics in the console, or consume JSON output from CloudWatch Logs in a monitoring system like Monyog.
Enhanced Monitoring is a free service until usage exceeds the free tier provided by Amazon CloudWatch Logs. After that Enhanced Monitoring is priced according to several factors, including:
- Monitoring interval: A smaller monitoring interval results in more frequent reporting of OS metrics and increases your monitoring cost.
- The number of DB instances: Usage costs for Enhanced Monitoring are applied for each DB instance that Enhanced Monitoring is enabled for. Hence, monitoring a large number of DB instances is more expensive than monitoring just a few.
- Workload: DB instances whose workload is more compute-intensive have more OS process activity to report and higher costs for Enhanced Monitoring.
Visit the Amazon CloudWatch Pricing page to obtain more information on Enhanced Monitoring prices.
Viewing DB Metrics by Using the CloudWatch CLI
Amazon RDS integrates with CloudWatch metrics to provide a variety of DB instance metrics. In addition to the RDS console, you can also view RDS metrics using the AWS CLI or API.
For example, invoking the mon-get-stats CloudWatch command with the following parameters displays usage and performance statistics for a DB instance:
PROMPT>mon-get-stats FreeStorageSpace

       --dimensions="DBInstanceIdentifier=mydbinstance"

       --statistics=Average

       --namespace="AWS/RDS"

       --start-time 2015-09-29T00:00:00

       --end-time 2015-09-2900:04:00
Results:
Time                 Average  Unit

2015-09-29 00:00:00  33.09    Percent

2015-09-29 00:01:00  32.17    Percent

2015-09-29 00:02:00  34.67    Percent

2015-09-29 00:03:00  32.33    Percent

2015-09-29 00:04:00  31.45    Percent
Here’s how to fetch the same statistics as above via the GetMetricStatistics CloudWatch API:
http://monitoring.amazonaws.com/

	?SignatureVersion=2

	&Action=GetMetricStatistics

	&Version=2009-05-15

	&StartTime=2015-09-29T00:00:00

	&EndTime=2015-09-29T00:04:00

	&Period=60

	&Statistics.member.1=Average

     &Dimensions.member.1="DBInstanceIdentifier=mydbinstance"	&Namespace=AWS/RDS

	&MeasureName=FreeStorageSpace

	&Timestamp=2009-10-15T17%3A48%3A21.746Z

	&AWSAccessKeyId=

	&Signature=
Integrating the Monyog Monitoring Tool with CloudWatch
Many people are unaware that you can collect metrics for database instances that reside on the Cloud using your own monitoring tools, much like you would for databases that reside on your own company infrastructure. These may offer extended monitoring functionality. For instance, you can correlate metrics from your cloud database with other parts of your infrastructure, such as applications that interact with that database. It may also be possible to massage and/or filter your metrics for specific uses. Monyog makes it easy to seamlessly integrate with the CloudWatch API in order to collect metrics from across your infrastructure and AWS.
Connecting to your RDS instance
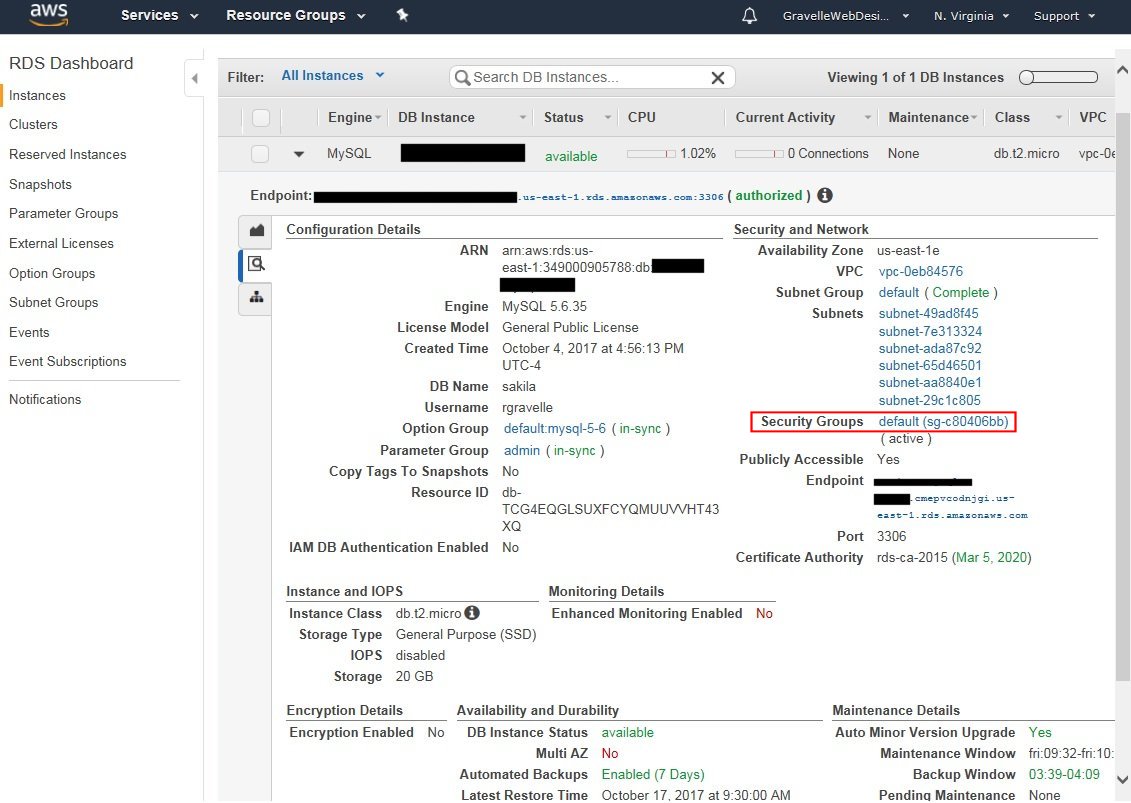
You cannot access your RDS instances directly as you would a local database. That being said, you can connect to your MySQL instance remotely using standard database tools, provided that you’ve configured the security group for your MySQL instance to allow connections from the device you are using to establish a connection.
Newly created DB security groups don't provide access to a DB instance by default. You must specify a range of IP addresses or an Amazon EC2 security group that can have access to the DB instance.
To add inbound rules to the security group
- Determine the IP address that you will use to connect to instances in your DB Instance. To determine your public IP address, you can use the service at http://checkip.amazonaws.com. If you are connecting through an Internet service provider (ISP) or from behind your firewall without a static IP address, you need to find out the range of IP addresses used by client computers.
Use 0.0.0.0/0 to enable all IP addresses to access your public instances. This approach is perfectly acceptable for a short time in a test environment but is unsafe for production environments. In production, always authorize only the specific IP address or range of addresses that will be accessing your instances. - Open the Amazon VPC console at https://console.aws.amazon.com/vpc/.
- Click on the security group that you’d like to grant users access to (highlighted in red above).
- Choose the Inbound Rules tab, and then click Edit.
- Set the protocol Type and IP Source for your new inbound rule. For instance:
- Type: HTTP (80)
- Source: 0.0.0.0/0.
- To save your settings, choose Save.
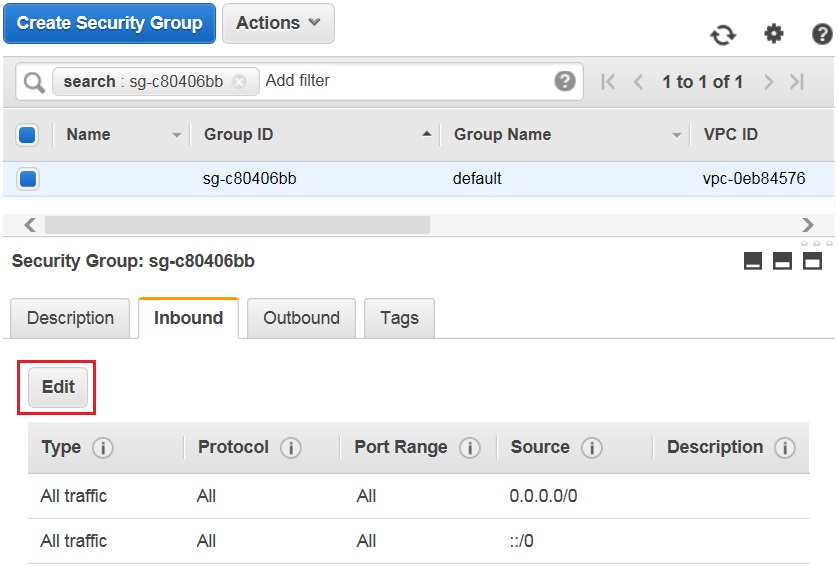
edit security group inbound rules
Once your access rules are in place, you can connect to your MySQL Instance using the mysql command line tool:
mysql -h instance-name.xxxxxx.us-east-1.rds.amazonaws.com -P 3306 -u yourusername -p
The instance endpoint (ending in rds.amazonaws.com) can be found in the list of instances on the RDS console.
Establishing a Connection to your RDS instance from Monyog
In Monyog, connecting to an RDS DB is no different than one that resides on your own infrastructure. All configured servers are located on the Servers screen, which is accessible via the Servers button, usually the top icon on the left-hand side.
- Click the ADD NEW SERVER button to bring up the Server Details dialog.

add new server button
- On the Server Details dialog, enter the following details:
- Your DB Instance endpoint.
- The MySQL port.
- Your USERNAME and PASSWORD.
- The CONNECTION TYPE.
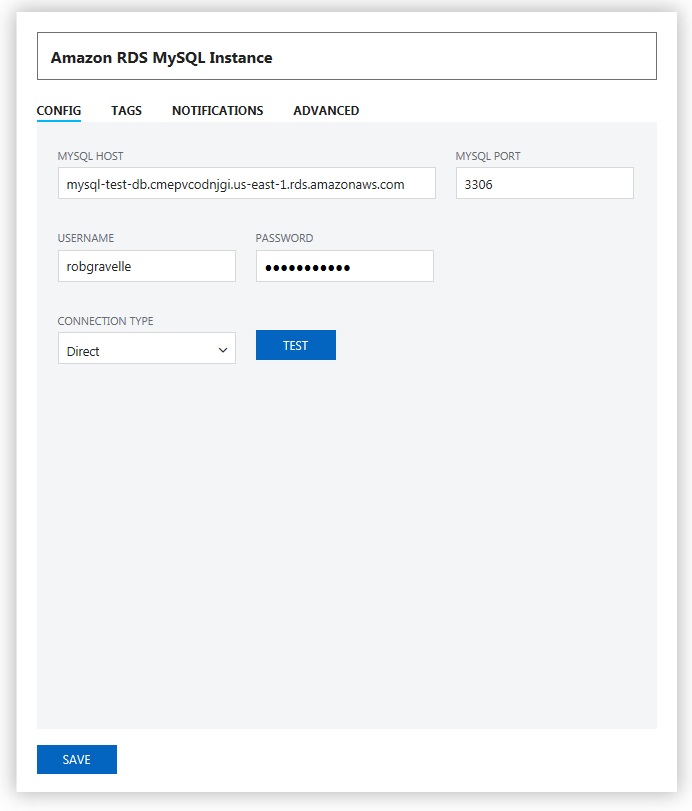
Amazon RDS connection screen
- When completed, click SAVE to create the connection and close the dialog.
Once the connection has been established, Monyog will immediately begin gathering metrics about your DB instance. You will be able to see some of them on the Dashboard:
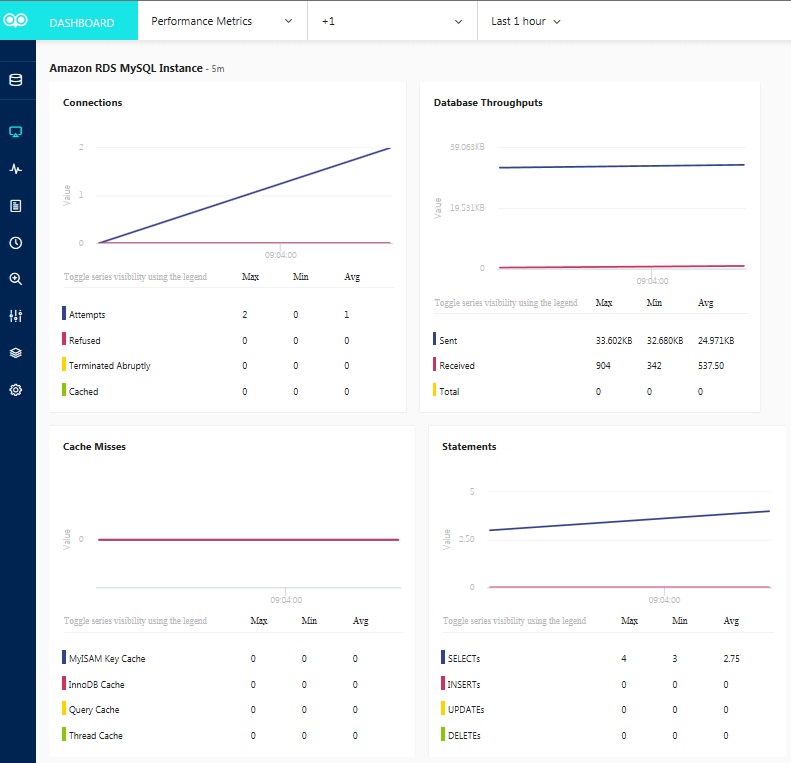
Monyog Amazon RDS Performance Metrics Dashboard
Viewing RDS Instance Metrics
The RDS/Aurora OS Monitoring feature introduced with Monyog 8.1.0 employs the CloudWatch API in order to fetch and display OS metrics that are exposed via the API. RDS/Aurora OS monitors are shown under the MONITOR GROUP as "RDS/Aurora Instance Metrics" on the Monitors page while the corresponding charts are available on the Dashboard page.
In order to be able to see the OS data, you should first verify that the RDS/Aurora Instance Metrics are enabled. To do that, click the plus (+) sign beside the MONITOR GROUP header on the MONITORS page and confirm that the slider is to the right and blue in color (and not gray):
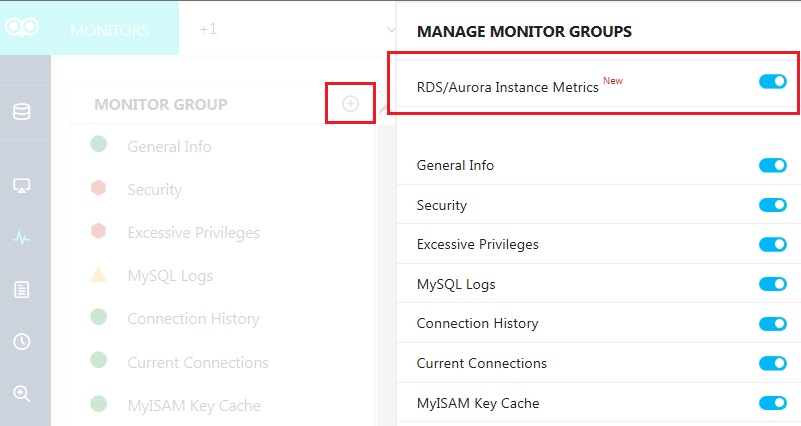
Monyog RDS-Aurora Instance Metrics
Editing RDS Instance Metrics
Clicking the "RDS/Aurora Instance Metrics" item under the MONITOR GROUP on the Monitors page shows the configured monitors. Each item in the MONITORS table is fully editable by clicking it:
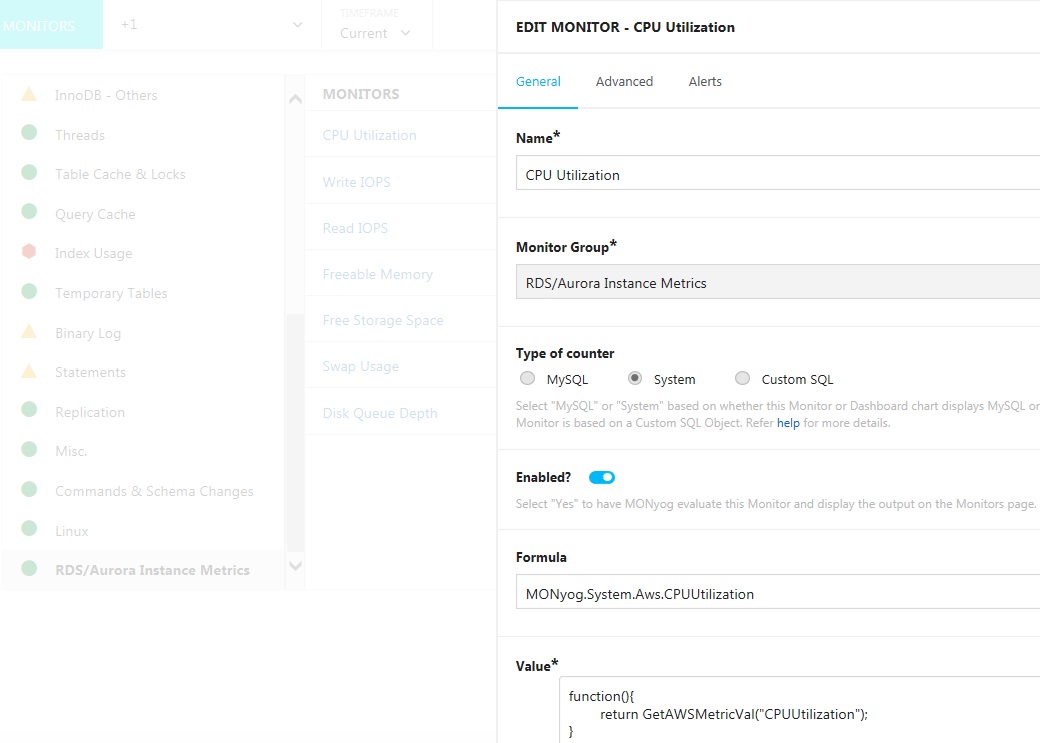
Monyog RDS-Aurora Instance Metrics – Edit monitor – CPU Utilization
Configure Custom RDS/Aurora Monitors
In addition to the default RDS/Aurora monitors, you can add new monitors via the MONITORS header dropdown list. These may be any available CloudWatch metric. Refer to the AWS site for the complete list of CloudWatch metrics available for RDS.
- Select Manage RDS/AURORA custom objects from the list:
- On the ADD/EDIT RDS/AURORA CUSTOM OBJECTS screen, click the plus (+) icon. Doing so will present a blank RDS/Aurora Object configuration screen. Here it is with a new Object defined:
- Go to Monitors -> RDS/Aurora Instance Metrics, click on the plus (+) icon, then select Add new monitor.
- Enter the Monitor name and the Monitor group name that you want to add the new monitor to. For instance, you would enter "RDS/Aurora Instance metrics" if you wanted to add it in this group.
- Select the "Type of counter" appropriate to your monitor:
- MySQL: database-related information.
- System: OS-related information.
- Custom SQL: for a Custom SQL object.
- Provide a Formula name.
- Enter a Javascript function in the Value field using the Cloudwatch metric like:
- From the Dashboard page, click the DASHBOARDS dropdown and select the pencil icon to the right of the Performance Metrics item:
- Locate your custom object in the list or enter the name in the search box to find it:
- Click the pencil icon to the right of the Item.
- Select the Type of Counter.
- Provide the Series Caption and Series Values:
- Click the SAVE button to add the chart and close the dialog.
- Don’t forget to activate your new chart on the Performance Metrics screen!
- Amazon’s RDS database platform provides statistics and advice about many types of metrics. These may be configured and consumed using a variety of online tools as well as via the CLI or API.
- The RDS Dashboard provides monitoring of both database and operating system (OS) metrics. A number of views are available including single and multi-graph layouts.
- Enhanced Monitoring may be utilized to gather and analyze metrics for your DB instance and its underlying operating system (OS) in real time but at a potential additional cost.
- Monyog version 8.1.0 introduced the RDS/Aurora OS Monitoring feature to make use of Amazon’s CloudWatch API and utilize the different OS metrics available with the API to fetch and display the data.
- Monyog features a number of default RDS/Aurora monitors and provides the ability to add new monitors. These may be any available CloudWatch metric.
- RDS charts may be added to the Monyog Dashboard page in order to create customized views.

monitors menu
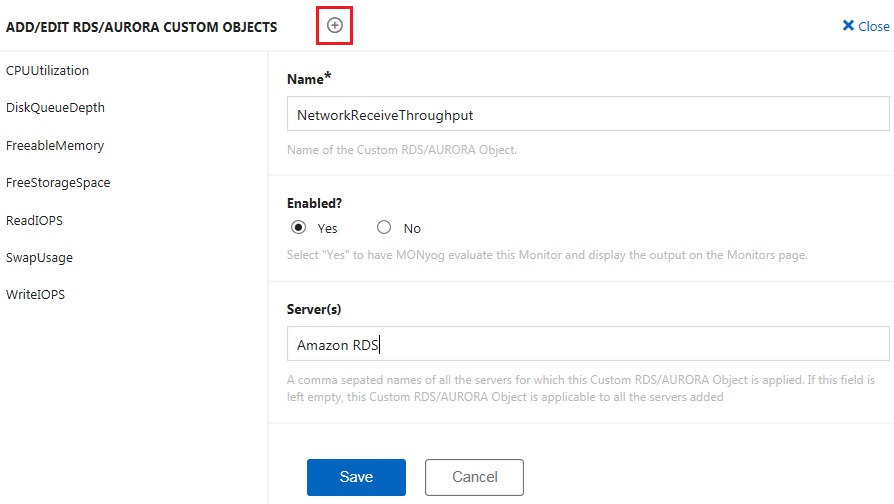
Adding a new custom monitor
Adding the Monitor
Once you’ve configured your new RDS/Aurora Custom Object you’re ready to add it to the list of the Monyog default metrics.
function() {

 	 return GetAWSMetricVal('NetworkReceiveThroughput');

}
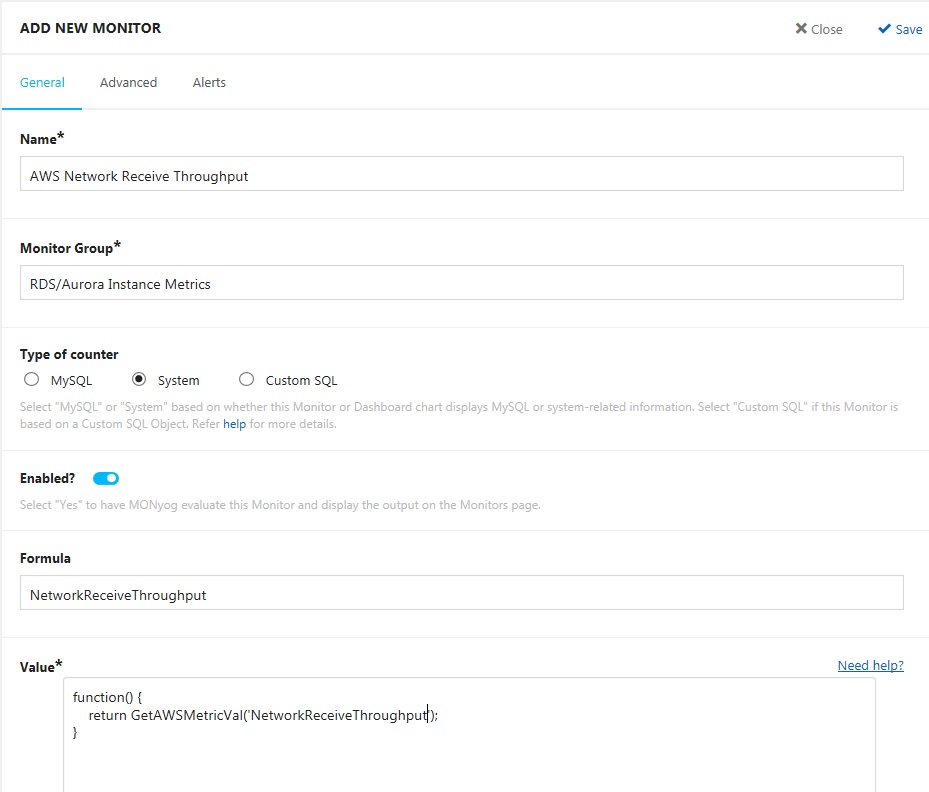
add new monitor screen
Adding New RDS/Aurora Dashboard Charts
The Monyog Dashboard page allows us to customize a dashboard with a particular set of charts. With respect to AWS RDS, you could create a dashboard with only RDS metrics charts for ease of monitoring.
In order to add an RDS/Aurora chart to the dashboard page, the corresponding RDS/Aurora custom object should be defined and enabled first. Then, follow the steps below to add the chart:
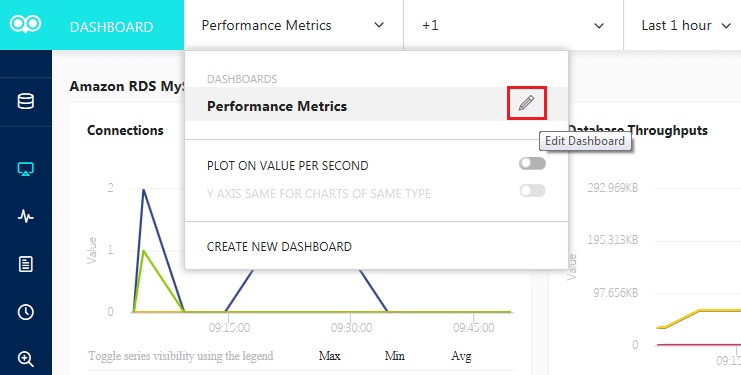
edit dashboard
On the Performance Metrics screen:
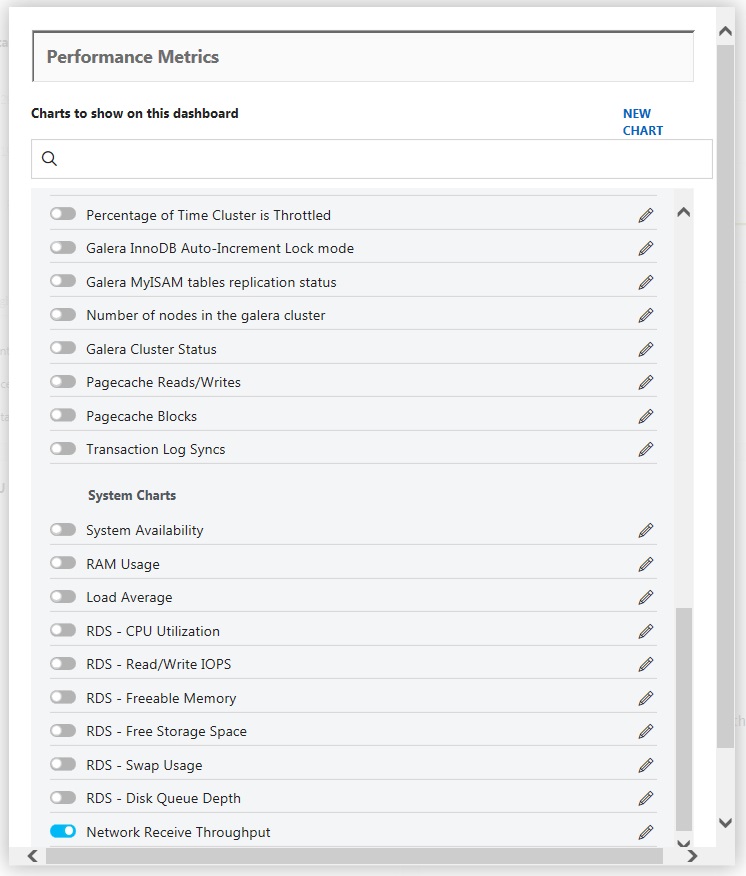
Performance Metrics charts with new chart added
In the Editor:
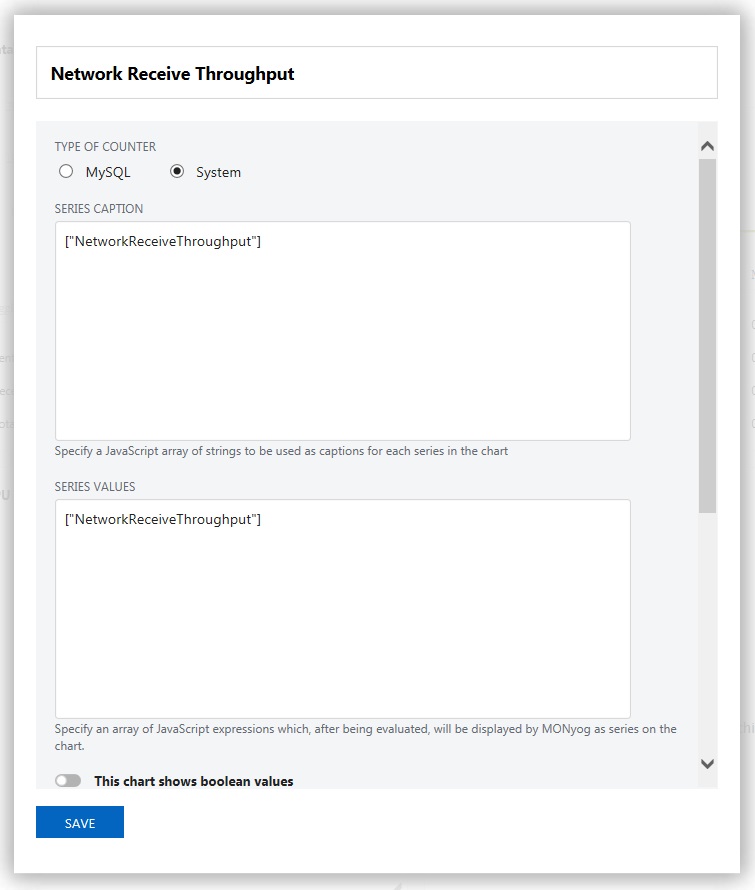
Add new chart
Conclusion
In this blog, we explored how to monitor MySQL Performance Metrics using both the Amazon monitoring tools as well as the latest version of Monyog in order to compare the strengths of each.
We learned that:
Moving database operations need not demand a whole new set of monitoring tools and interfaces. With Monyog’s Amazon RDS/Aurora integration, you can continue to utilize the monitoring tool that you already know and trust.
Monyog is a MySQL monitoring tool that improves the database performance of your MySQL powered systems. Download your free trial.
