Monyog MySQL Monitor v8.3.0 is a feature-rich release which adds a large number of user requests for quick access to relevant monitoring information, for 'cross-plotting' multiple servers in a unified chart and more. Additionally, it adds a number of non-critical bug fixes.
Changes as compared to Monyog MySQL Monitor v8.2.0 include:
Features:
- Added option to set a distinct email distribution list for warning alerts and critical alerts.
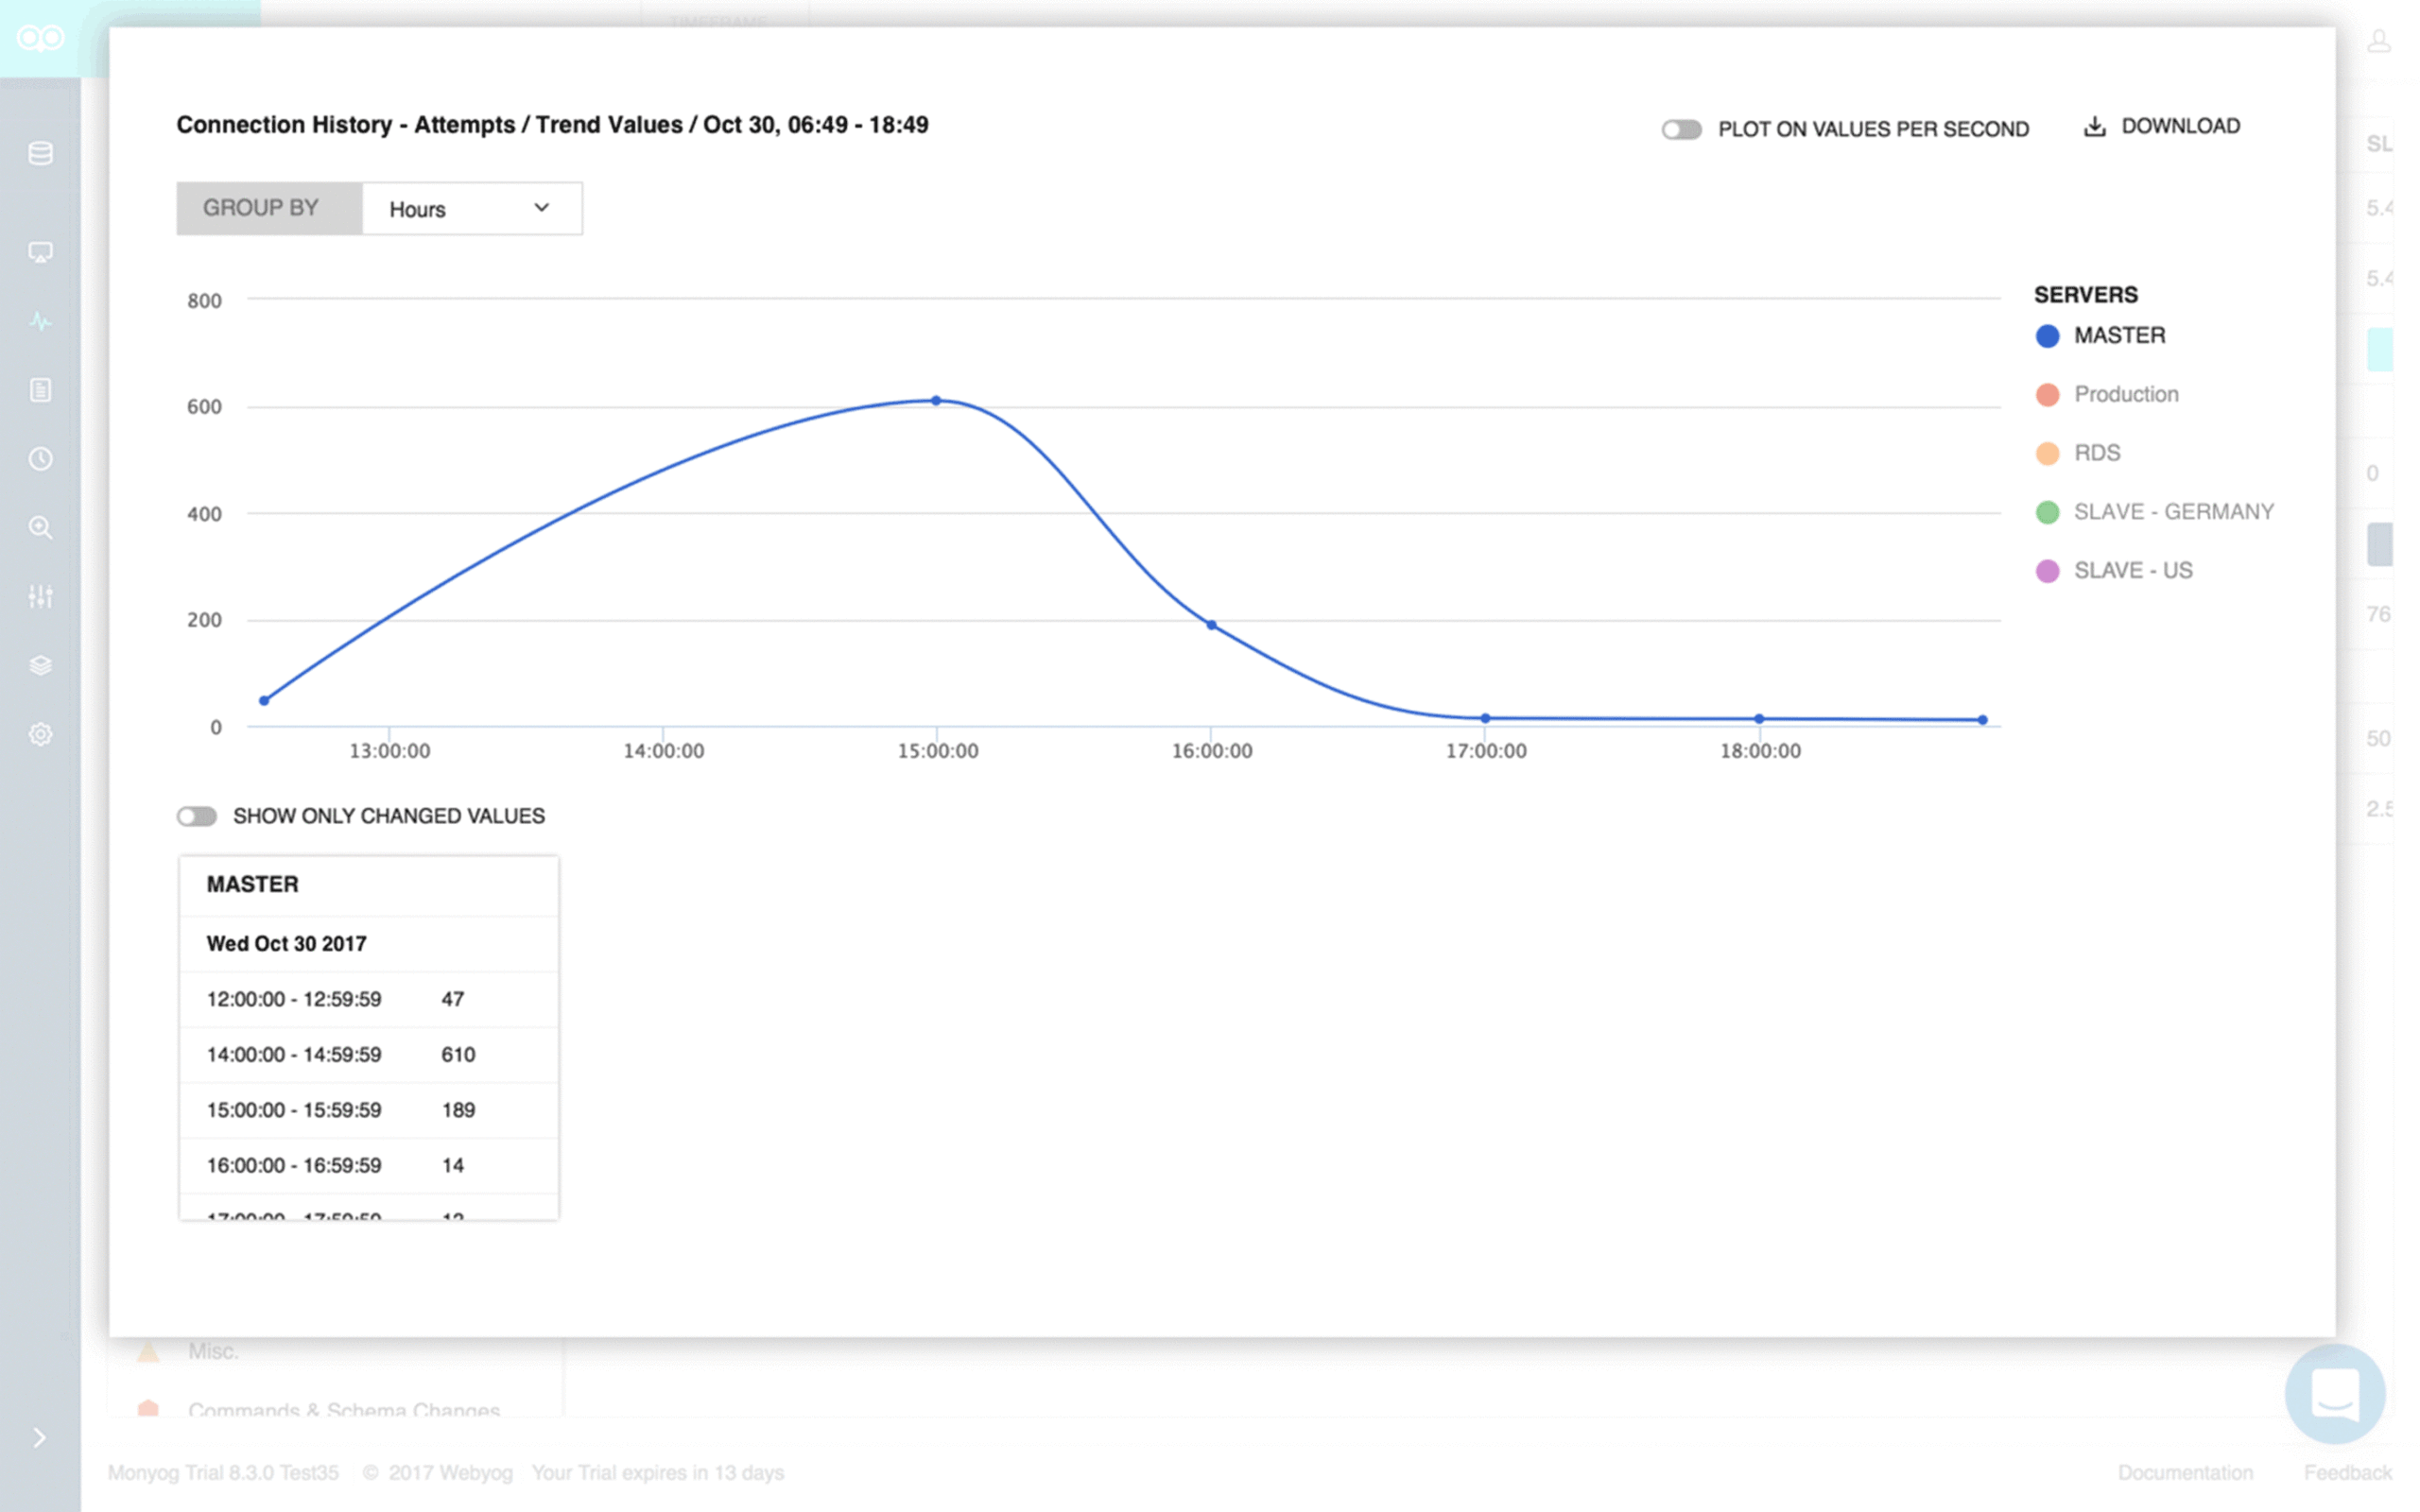
- Trend Graph Analysis: Added option to group a single metric (which one you find most important) from different servers into one unified chart. This allows you to visually analyse a metric across servers at various points in time.
Choose the monitor group >> Click on the trend graph icon next to the metric as shown below.

Select the trend graph corresponding to the required metric

Monitor single metric across servers
- Added option for disk monitoring of the system where Monyog is installed. In case the free space on the system where Monyog is installed goes below a defined threshold value, Monyog will raise an alert.
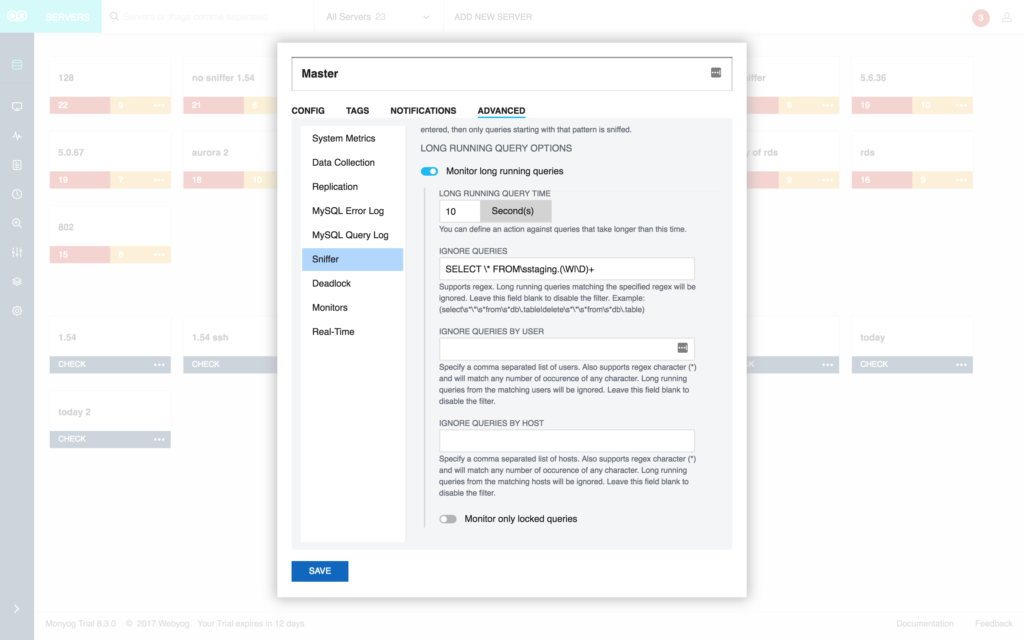
- Added a REGEX-based filter to exclude unwanted long_running queries in Sniffer. Monyog will ignore queries satisfying the expression and neither kill nor send an alert for such.

REGEX-based filter to exclude unwanted long_running queries
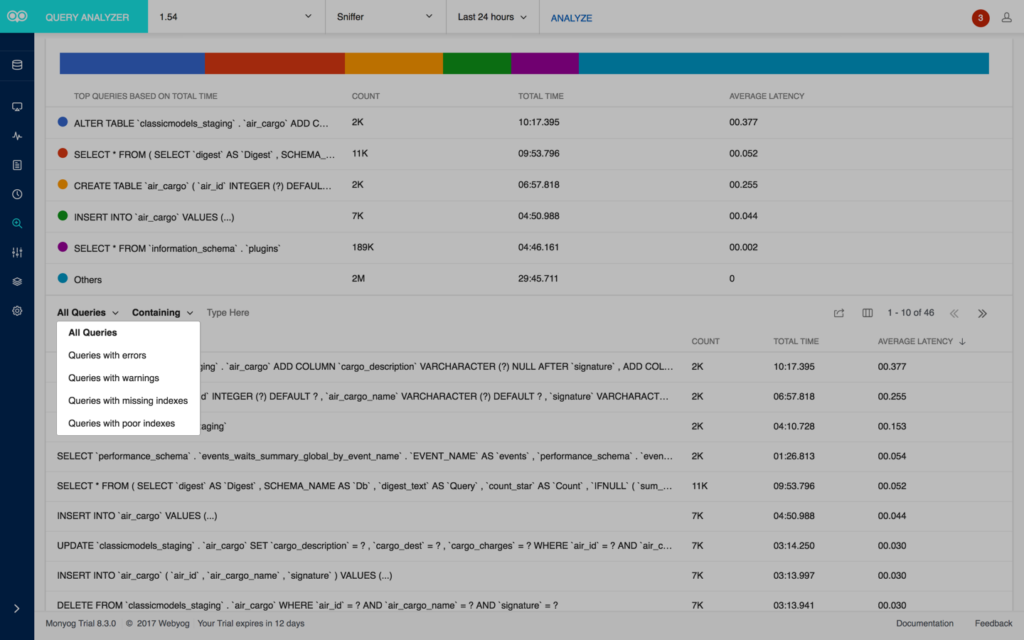
- Added option to filter queries based on poor indexes, missing indexes, errors and warnings. This feature is available for PERFORMANCE SCHEMA based sniffer in Query Analyzer and "Show details" page in Dashboard. When you choose a filter, Monyog will show queries based on the criteria set.

Filter queries based on poor indexes, missing indexes, errors and warnings
- Redesigned Server selector GUI.
- Redesigned Query Analyzer GUI: a more intuitive view of the top 5 queries based on total time has been added.

A more intuitive view of the top 5 queries based on total time has been added
- Added Y-axis unit for charts, along with the option to define the units and unit-factors.
Bug Fixes:
- Fixed bogus “UNIQUE constraint failed..” -errors in MONyog.log.
- In rare cases real-time page hanged on switching between real-time sessions.
- In Option to plot values based on data collection in History/Trend analysis(For uptime counters) only "Group By" -option was available for those counters.
- Monyog failed to recognise Aurora instances for OS monitoring. The four required fields for OS monitoring were not displaying.
- Email addresses with "+" in monitor level notification settings was not accepted.
- Added "DB" as a column under ‘Manage Columns’ in Dashboard’s ‘show details’ page in ‘Processlist’ mode.
- Monyog showed the total time and average latency as "0" when the execution time of the query was less than a second for table based slow query log.
- Fixed an issue with Custom SQL Object (CSO) – Monyog logged entries like “not an error” in MONyog.log.
- Server name with '&' in it was not getting deleted.
- In some rare cases, Monyog failed to generate alert if the network connection on the machine where MySQL is running goes down.
- Some monitors in the linux monitor group gave NaN while doing History/Trend Analysis.
You can download a 14-day free trial of Monyog here.
Purchase Monyog: https://www.webyog.com/product/monyogpricing