With Halloween all but a distant memory, the time has come to turn our attention to the upcoming holiday season. First, Thanksgiving, then Black Friday and Cyber Monday, culminating in the Christmas/boxing week shopping bonanza. For business owners, this time of the year marks the long-awaited year’s end profit taking. For some DBA’s, it brings fear, trepidation, and even sleepless nights toiling away to bring systems back online.
Thankfully, this need not be the case. With a little proactive tweaking of MySQL performance variables, you can insulate your database server(s) against the onslaught of increased demand that the shopping season brings.
Tip #1: Determine the Maximum Number of MySQL Connections
A good starting estimate for the maximum number connections on MySQL is one for every five requests to your web server. A few of those five requests to your web server will be for resources like CSS style sheets, images, and scripts. It can be difficult to get an accurate MySQL to web server request ratio due to things like browser caching; to get an exact figure, you’ll need to analyze your web server’s log file. For example, Apache’s “access_log” log file may be accessed manually, or via utilities such as Analog or Webalizer.
Once you’ve arrived to an accurate estimate for your particular usage, multiply that ratio by your web server’s maximum number of connections. For example, if your web server is configured to serve a maximum of 256 clients, and your ratio of MySQL requests vs. web requests is 1/8, you’d want to set your maximum number of database connections to 32. To include a safety margin, multiply that number by two, to arrive at your final number. Only if you have the infrastructure to support it should you attempt to match the maximum number of database connections to your web server’s client limit. In most cases, you’d be best to keep it closer to 32.
Viewing MySQL Connections in Monyog
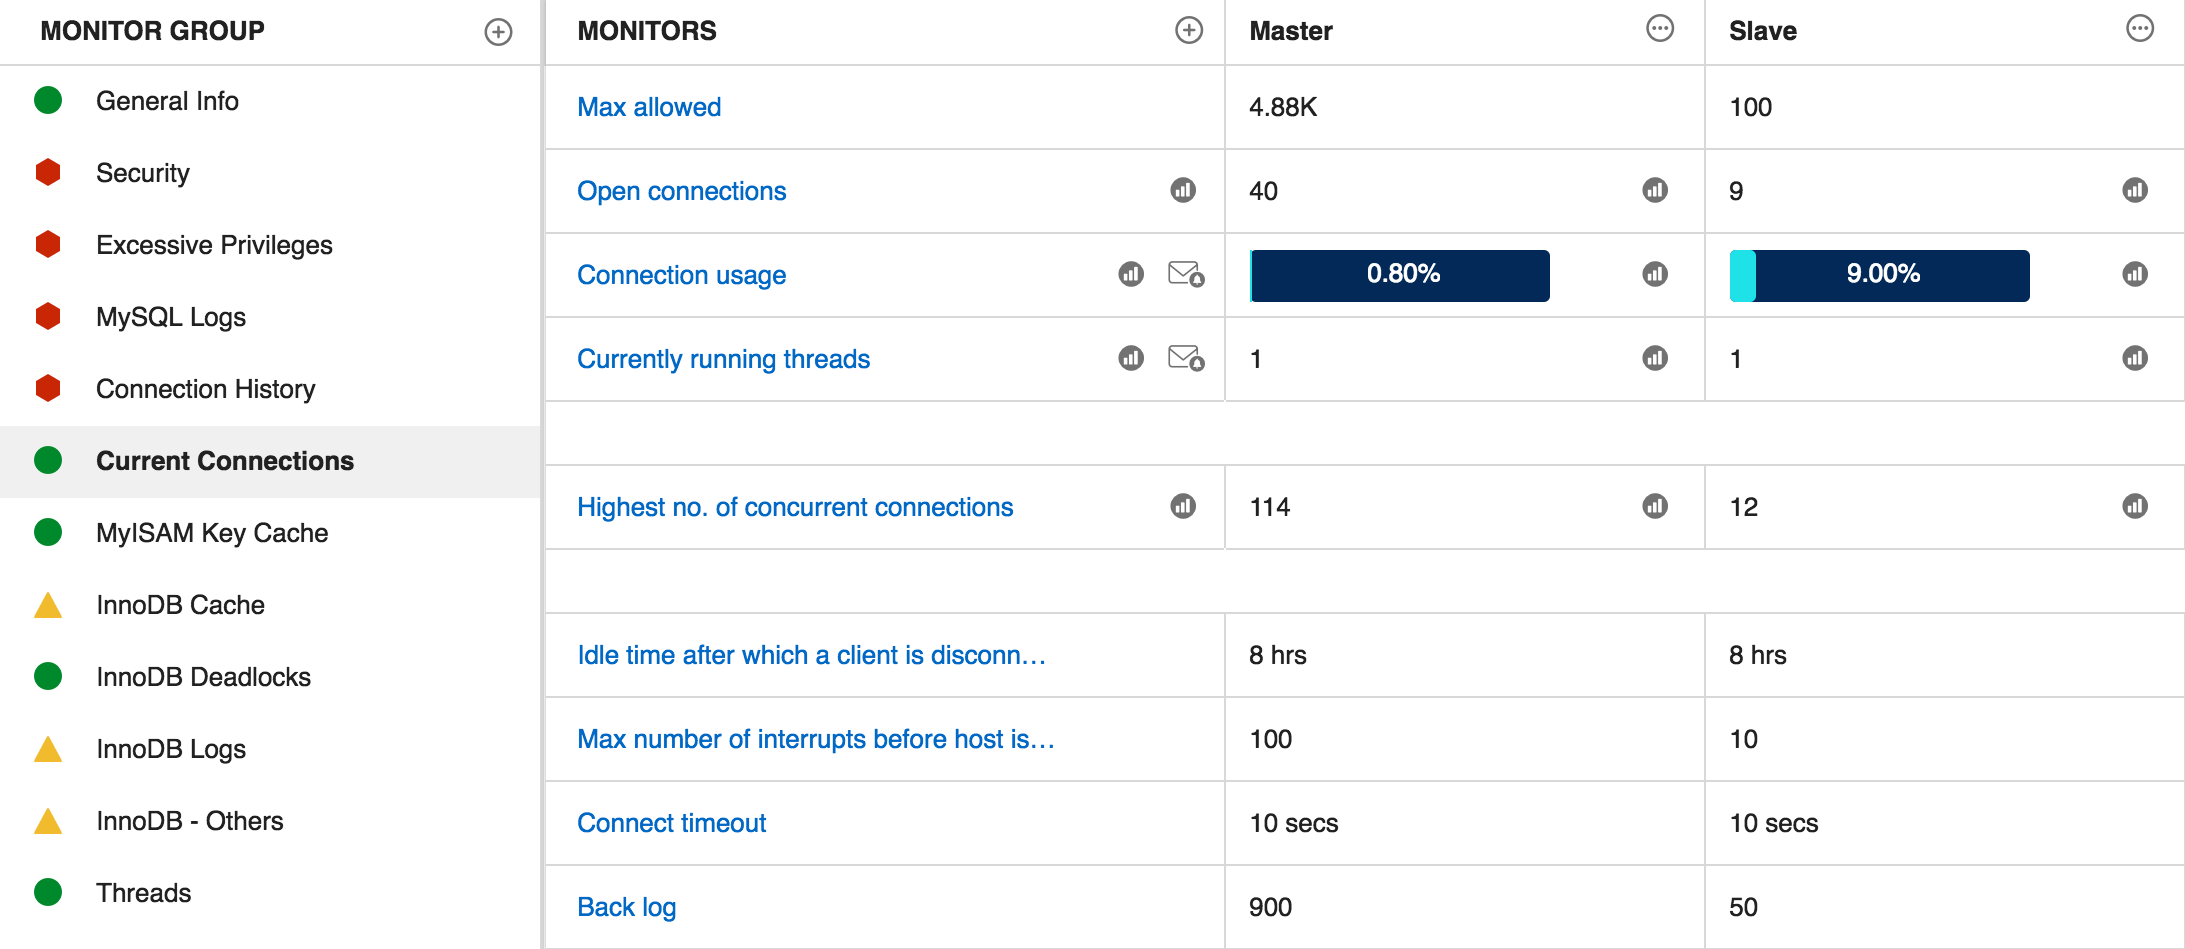
In MySQL, the maximum number of concurrent connections to MySQL is stored in the global max_connections variable. Monyog reports the max_connections variable as the “Max allowed” metric in the Current Connections monitor group. It also divides that figure by the number of open connections to produce the Connection usage as a percentage:
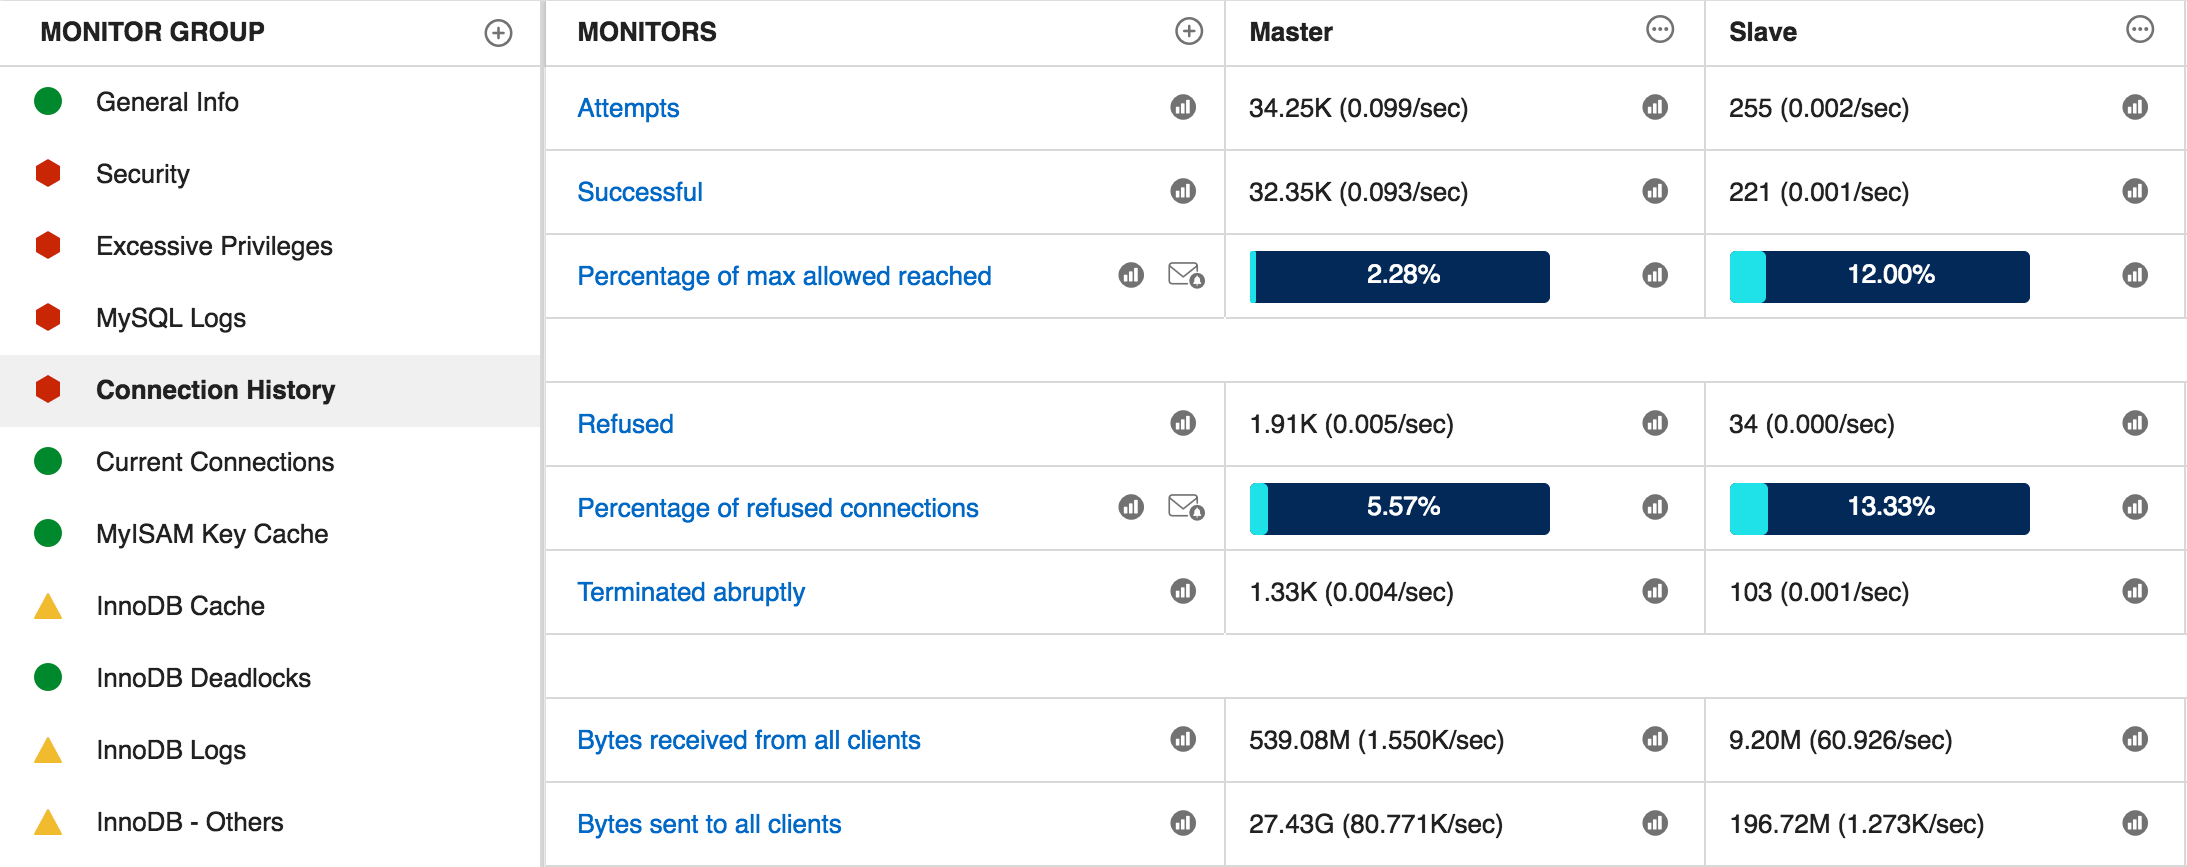
There is also a Connection History monitor that can be instrumental in calculating the optimal maximum number of concurrent connections. It includes the number of attempted, refused and successful connections. Moreover, the Percentage of max allowed reached metric is displayed as a progress bar that allows you to quickly assess how close to the maximum number of concurrent connections a server has reached in the past:
Tip #2: Allocate Sufficient Memory to Temporary Tables
In some cases, the server creates internal temporary tables while processing statements. Temp tables are used for internal operations such as group by and distinct, some ORDER BY queries, UNION, and subqueries in the FROM clause (derived tables). These are created in-memory as Memory tables. The maximum size for in-memory temporary tables is determined from whichever of the values of tmp_table_size and max_heap_table_size is smaller. If a temp table’s size exceeds this threshold, it is converted to an on-disk InnoDB or MyISAM table. Moreover, temporary tables always go directly to disk if the query involves BLOB or TEXT columns, which can’t be stored in Memory tables.
This conversion is expensive, so consider increasing the size of the max_heap_table_size and tmp_table_size variables to help reduce the number of temporary tables created on disk. Keep in mind that you’ll need a lot of memory because the size of in-memory temporary tables is based on the “worst-case”. For example, memory tables always use fixed-length columns, so VARCHAR(255) is employed for char columns. This can make the in-memory temporary tables much larger than you’d think – in fact, many times larger than the total size of the table that’s being queried! When increasing the size of the max_heap_table_size and tmp_table_size variables, be sure to monitor your server’s memory usage, because in-memory temporary tables can raise the risk of reaching the server’s memory capacity.
Generally 32M to 64M is the suggested value to begin with for both variables and tune as needed.
Temporary Tables Monitor in Monyog
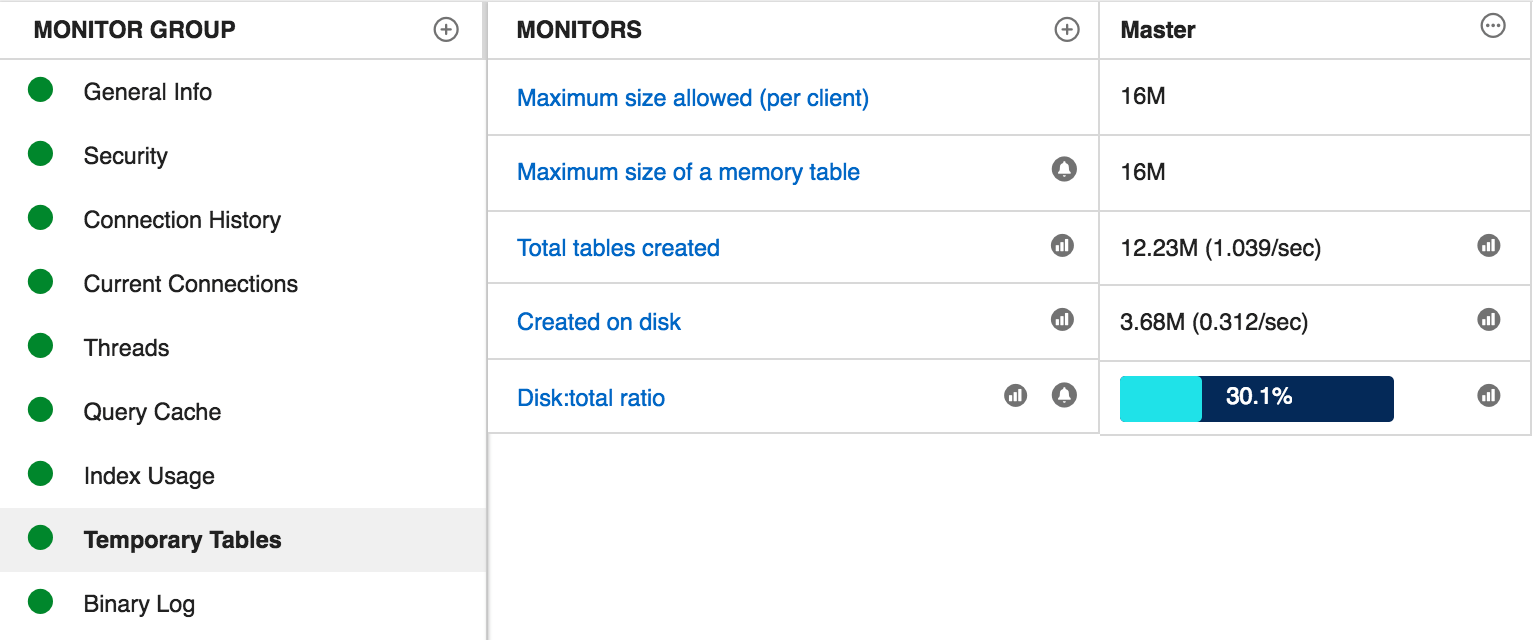
The Temporary Tables Monitor is one of the many predefined Monyog monitors. It provides several metrics on temporary table usage including:
- Maximum size allowed:
Displays the value of the tmp_table_size server variable, which defines the maximum size of temporary tables created in memory. Along with the max_heap_table_size, this size defines the maximum size of an internal table that can be created in memory. If an internal table is larger than this size, it is stored on disk. - Maximum size of a memory table:
Displays the value of the max_heap_table_size server variable, which defines the maximum size of a MEMORY storage-engine table that is created explicitly. - Total tables created:
Displays the value of the created_tmp_tables server variable, which defines the number of temporary tables created in memory. - Created on disk:
Displays the value of the created_tmp_disk_tables server variable, which defines the number of temporary tables created on disk.
If this value is high, you should consider increasing the value of tmp_table_size and max_heap_table_size. - Disk:total ratio:
A calculated value based on created_tmp_disk_tables divided by created_tmp_tables.
The percentage of temporary tables that got created on disk because of insufficient tmp_table_size or max_heap_table_size. Monyog presents this figure as a progress bar and percentage in order to quickly determine how much disk is being utilized for temp tables, as opposed to memory.
Trend graphs are available for the Total tables created, Created on disk, and Disk:total ratio values. These allow us to see their evolution over time:

Tip #3: Increase the Thread Cache Size
Connection manager threads handle client connection requests on the network interfaces that the server listens to. Connection manager threads associate each client connection with a thread dedicated to it that handles authentication and all request processing for that connection. Hence, there is a one-to-one ratio between threads and currently connected clients. It’s important to make sure that the thread cache is large enough to accommodate all incoming requests.
MySQL offers a number of server variables pertaining to connection threads:
The thread cache size is determined by the thread_cache_size system variable. The default value is 0 (no caching), which causes a thread to be set up for each new connection and disposed of when the connection terminates. If you expect your server to receive hundreds of connection requests per second you should set thread_cache_size high enough so that most new connections use cached threads. You can set max_connections at server startup or at runtime.
You should also monitor the number of threads in the cache (Threads_cached) and how many threads have been created because a thread could not be taken from the cache (Threads_created). Regarding the latter, if Threads_created continues increasing at more than a few threads per minute, consider increasing the value of thread_cache_size.
Use the MySQL show status command to show MySQL variables and status information. Here are a couple of examples:
SHOW GLOBAL STATUS LIKE '%Threads_connected%';

+-------------------+-------+

| Variable_name     | Value |

+-------------------+-------+

| Threads_connected | 2     |

+-------------------+-------+
SHOW GLOBAL STATUS LIKE '%Threads_running%';

+-----------------+-------+

| Variable_name   | Value |

+-----------------+-------+

| Threads_running | 1     |

+-----------------+-------+
Monyog Thread Cache Monitor
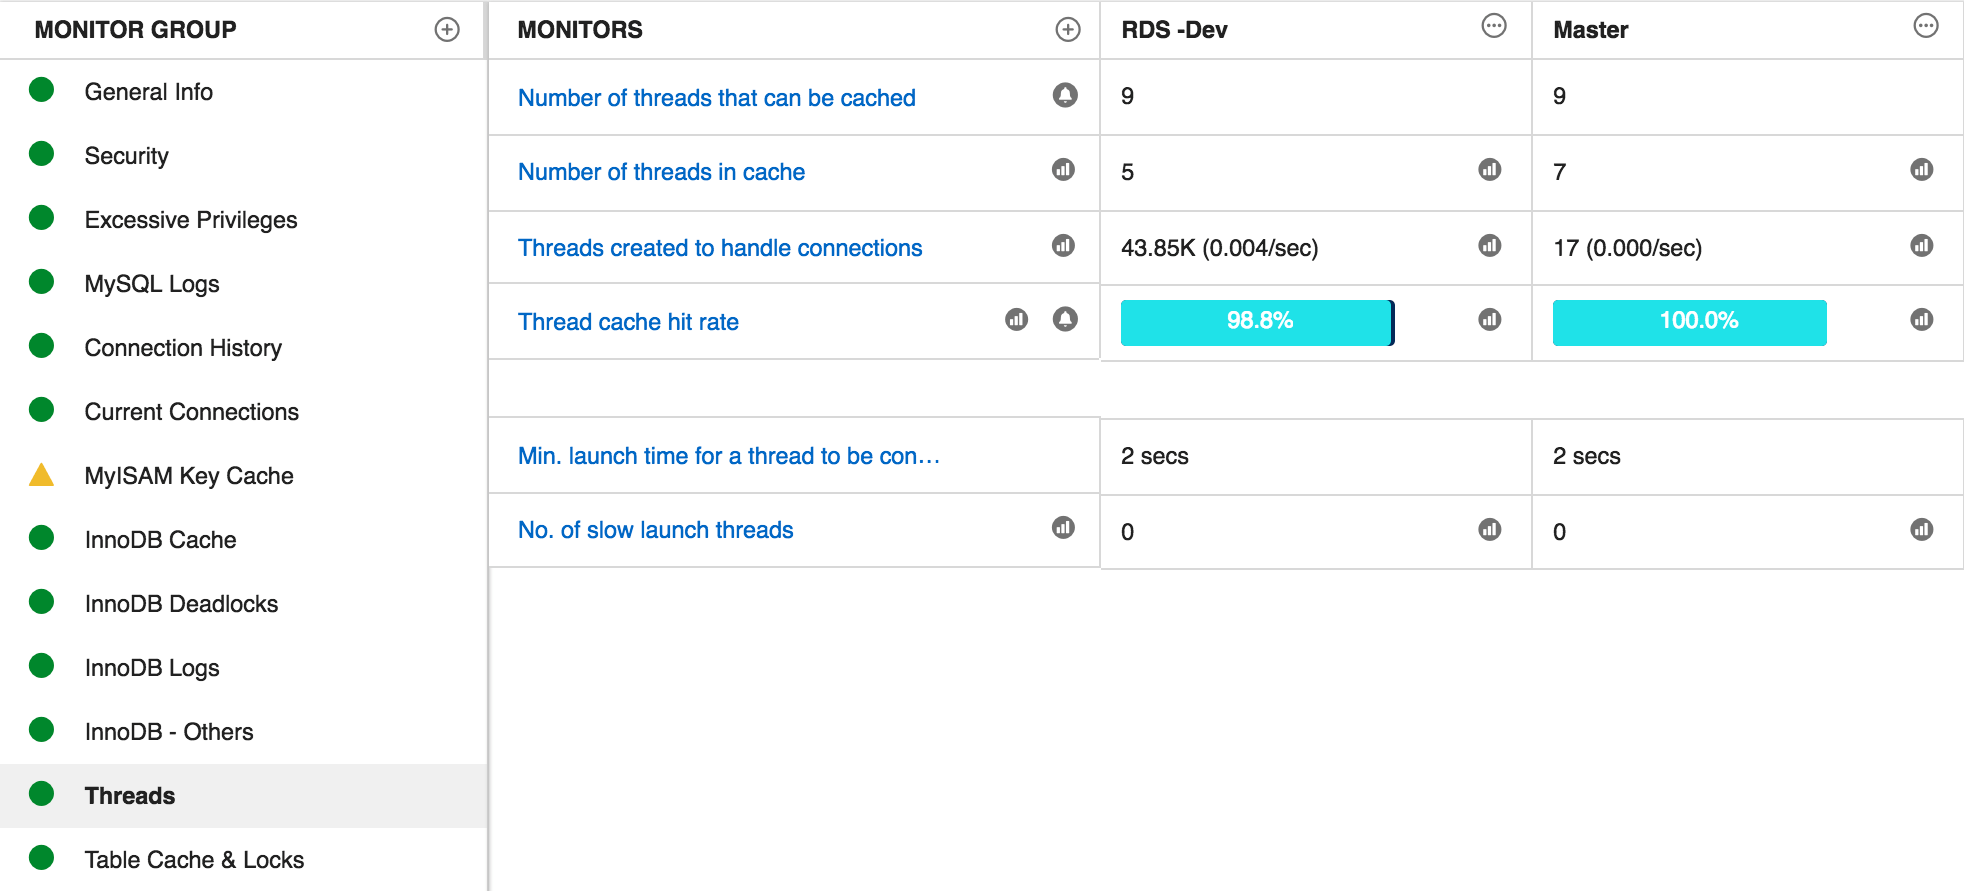
Monyog provides a screen for monitoring Thread Caching named “Threads”. The MySQL thread-related server variables map to the following Monyog metrics:
- thread_cache_size: Number of threads that can be cached.
- Threads_cached: Number of threads in cache.
- Threads_created: Threads created to handle connections.
The Monyog Threads screen also includes the “Thread cache hit rate” metric. It’s a fraction that gives an indication of thread cache hit rate. If the value is low, you should consider increasing the thread cache. A status bar shows this value as a percentage; the closer to 100%, the better.
Each of these metrics can be configured to send out warning and/or critical alerts if their value equals or exceeds the specified values.
Other Relevant Server Variables
In addition to the above metrics, you should also monitor the following:
- InnoDB Buffer Pool Size:
The InnoDB buffer pool size plays a major role in MySQL databases using InnoDB. The buffer pool caches both data and indexes. It should be set as large as possible to ensure that your database uses memory and not hard drives for read operations. - Temporary Table Size:
MySQL uses the lower of max_heap_table_size and tmp_table_size to limit the size of temporary tables in memory. Having a large value can help reduce the number of temporary tables created on disk, but also raises the risk of reaching the server’s memory capacity because this metric applies to each client. Generally 32M to 64M is the suggested value to begin with for both variables and tune as needed.
- InnoDB Log Buffer Size:
Every time that MySQL writes to the log file, it utilizes important system resources that could be put towards processing sales. Therefore, it only makes sense to set the InnoDB log buffer size to a large value. That way, the server writes to disk less often during large transactions, thus minimizing those time consuming operations. 64M is a good starting point for this variable.
Conclusion
While even the largest corporations’ websites incur losses due to downtime from time-to-time, the impact is especially critical for small, medium and home industries dealing with the online sales. According to a report on a recent survey, one single minute of outage leads to about $5000 average losses to companies. Don’t let your business become part of that statistic. Be proactive in tuning your MySQL database server(s) before the holiday rush and reap the rewards!