


So you’re a DBA and your manager comes in and says that the BI team wants to install and configure an instance of Analysis Service. Oh and by the way, you are going to be responsible for monitoring the availability and performance of the instance as well as making recommendations for performance improvements. So you’re like no problem it’s just SQL Server right? All of the “tricks of the trade” for SQL Server you have learned over the years will work right? Then you do some research and find out that Analysis Services is not your grandmother’s SQL Server.

So now what are you going to do? Well, this series of blog articles will open the “black box” that is Analysis Services and highlight key areas of performance that you should be looking at when monitoring. In part 1 we will discuss the overall architecture of Analysis Services. It is critical to have a good understanding of how Analysis Services works under the hood when doing performance troubleshooting.
Architecture
First of all Analysis Services has its own engine, separate from the SQL Server database engine. You can install Analysis Services on the same SQL Server, however, in most production environments you will see it installed in a standalone configuration. There are two basic semantic models that can be deployed:
- Multidimensional (cube) – this uses OLAP modeling constructs, dimensions, and measure groups.
- Tabular – uses relational modeling constructs such as tables and relationships for modeling data and an in-memory analytics engine for storing and calculating data.
We will cover tabular in a later article, for now we will concentrate on the multidimensional model. For a comparison between the two see “Comparing Tabular and Multidimensional Solutions (SSAS)” .
One thing to note, when you install Analysis Services it will ask you which semantic model you want to use. You cannot have both models running on the same instance. Microsoft is supposed to fix this in a later version of SQL Server.
There are two basic categories of activity: query processing and cube processing. Processing of the cube entails updating data and aggregations. This article will look at query processing.
Query Processing
The most common method for querying the cube is through MDX queries. MDX is a language similar to SQL that is optimized for querying and manipulating the multidimensional data stored in OLAP cubes. The goal here is to give you enough ammo to determine if a query needs optimization or a performance issue lies elsewhere in Analysis Services.
When we peel back the onion, the basic architecture looks like this:
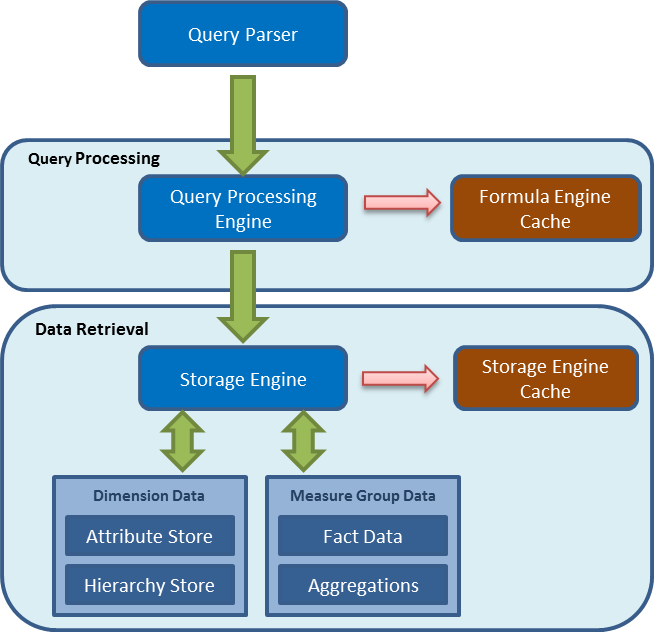
Query Parser
The query parser has an XMLA listener which is listening for requests to the Analysis Services engine. It parses the request and passes it along to the Query Processor for execution.
Query Processor
Once the query is parsed it is passed on to the Query Processor, which prepares an execution plan. The Query Processor caches the results in the Formula Engine Cache so it can be reused across users. The Formula Engine is single threaded so each request is processed by a single core. When a query is processed it makes a request to the Storage Engine to retrieve the data. This is referred to as sub cube data (a subset or logical unit of data for querying, caching and data retrieval).
Storage Engine
The Storage Engine(SE) handles the requests for sub cube data from the Query Processor. It goes through a series of steps to retrieve the data. It first checks to see if the sub cube data is in the Storage Engine cache, if it is then it will retrieve it from there. If not it checks to see if the aggregation is available from the cube, if it is then it gets it from the aggregation store and caches it. If not then it gets the data and calculates the required aggregations and caches the result in the Storage Engine and sends the result to the Query Processor.
The SE is multi-threaded and reads and writes data from the file system. This means that is uses the Windows file cache to look to see if the data is cached. SQL Server’s relational engine has its own internal cache and does not use the Windows file cache for database files. So Analysis Services utilizes both the file system cache and its own internal caches to get data.
Analysis Service’s Internal Caches
I want to talk for a second about how Analysis Services caches data. The Formula Engine has two internal caches, one that caches flat data and one that caches calculated data. These caches have different scopes. The flat cache for example is limited to 10% of the TotalMemoryLimit property of the Analysis Services instance.
When looking at performance optimization of the internal caches we most often look at the Storage Engine caches. These consist of the Dimension and Measure Group Cache. In Part 3 we will begin to look at the Storage Engine cache and effects on performance.
So How Does It All Work?
So putting it all together, what happens when Analysis Services receives an MDX query:
- Query is accepted then its parsed by the Formula Engine.
- It retrieves whatever data it can for the query from the FE cache.
- The FE then requests any data it needs from the Storage Engine.
- The SE retrieves whatever it can from the SE caches.
- If more data is needed then it retrieves the data from the files system.
These steps are repeated as needed, moving data constantly between the FE caches, SE caches, file system, etc.
In part 2 we will look more in depth into the things that can have an impact on MDX query performance.