Where do you start when monitoring the performance of your database?
There are many different methodologies to help you. You could look at the slowest transactions on average and tackle those. You could look at those wait events that are the heaviest in time.
The problem with these approaches is that they can be hit or miss. A slow transaction (SQL statement) that runs for 30 seconds may seem like an obvious choice. However, that statement could only run once, whereas a transaction that executes 3 seconds on average and executes more than 1000 times is a better choice for carrying out a performance investigation.
It would be a better approach to understand what is consuming the most time and resource in the database or instance and then focus on that. This approach shows you the events that are consuming the most time and resource and therefore having the biggest impact on the instance.
By knowing what is consuming the most resource and time allows you to achieve the biggest benefit by tackling these events first. If an event is consuming 25% or more of the processing time in an instance then by tuning that event first can potentially allow us to save up to 25% of that instance. Alternatively, if we tackle an event that is consuming only 5% of the time and resource in the instance, then the biggest improvement we can make is only up to 5%.
What do I mean by an event?
- An event is anything that is consuming time and resource in the instance.
- An event could be a SQL statement that is running.
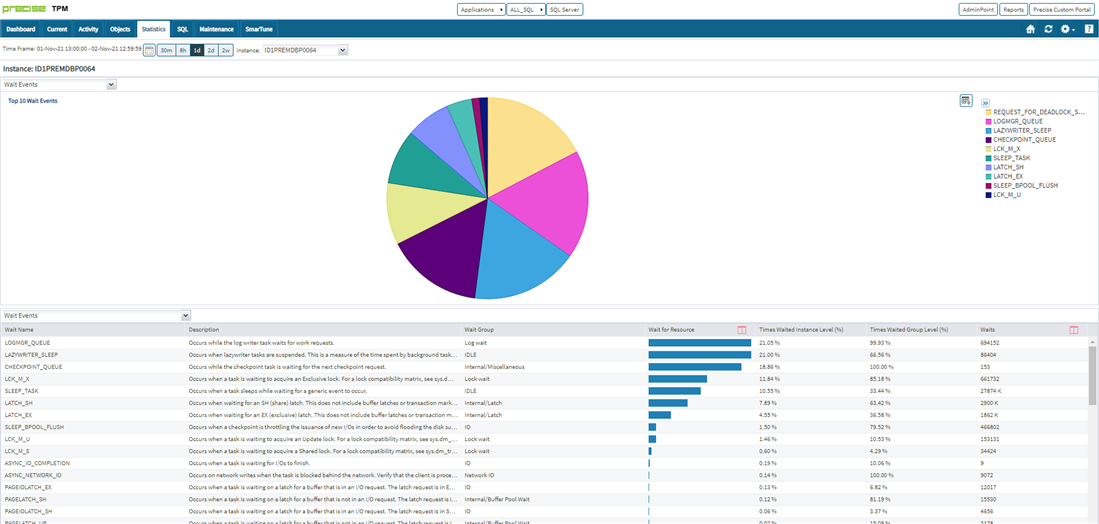
- An event could be a wait event that is consuming a lot of time such as a locking issue for example
- An event could also be a database object (a table or index) that is hot and is being accessed frequently and potentially inefficiently.
A lot of performance monitoring tools do not use this approach and therefore do not help you to achieve the benefit of reducing performance issues in your instance.
With PRECISE, we have a performance-monitoring tool that uses this approach of identifying those events that are consuming the most resource and time.
PRECISE categorises the events and shows you those that are consuming the most in your instance.
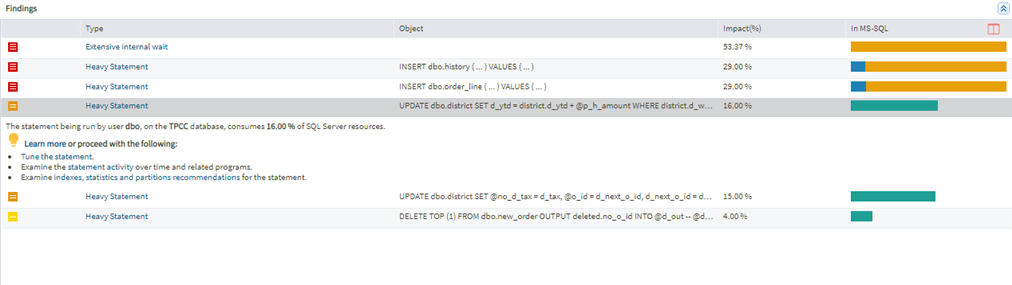
PRECISE identifies performance issues and labels them as ‘Findings’. It colour codes them based on the impact that they are having on your instance.
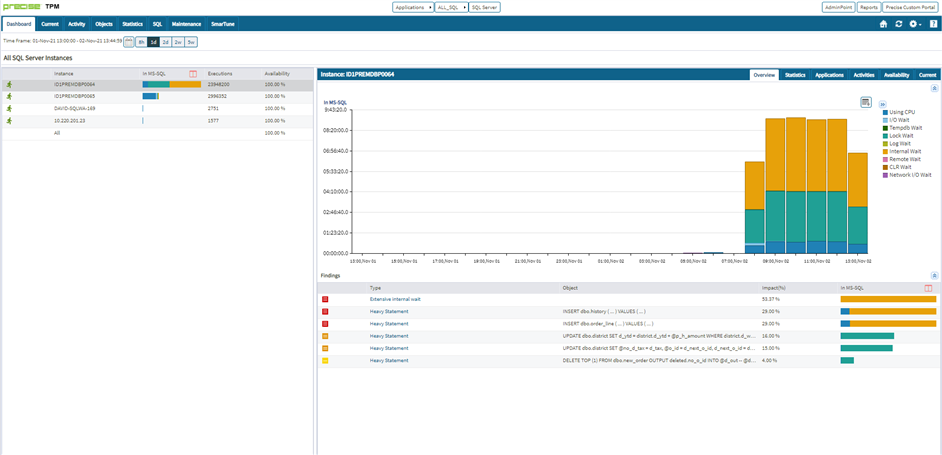
A RED finding is a performance issue that is consuming more than 20% of the total time in your instance. This needs to be urgently looked at!
An AMBER finding is a performance issue that is consuming more than 10% of the total time in your instance. This is having a heavy impact on your instance.
A YELLOW finding is a performance issue that is consuming more than 5% of the total time in your instance.
This is the starting point for looking at the performance of your instance. By investigating each of these performance issues you will go a long way to reducing the performance impact on your instance.
PRECISE allows you to investigate each of these performance issues quickly and identify recommendations for them.
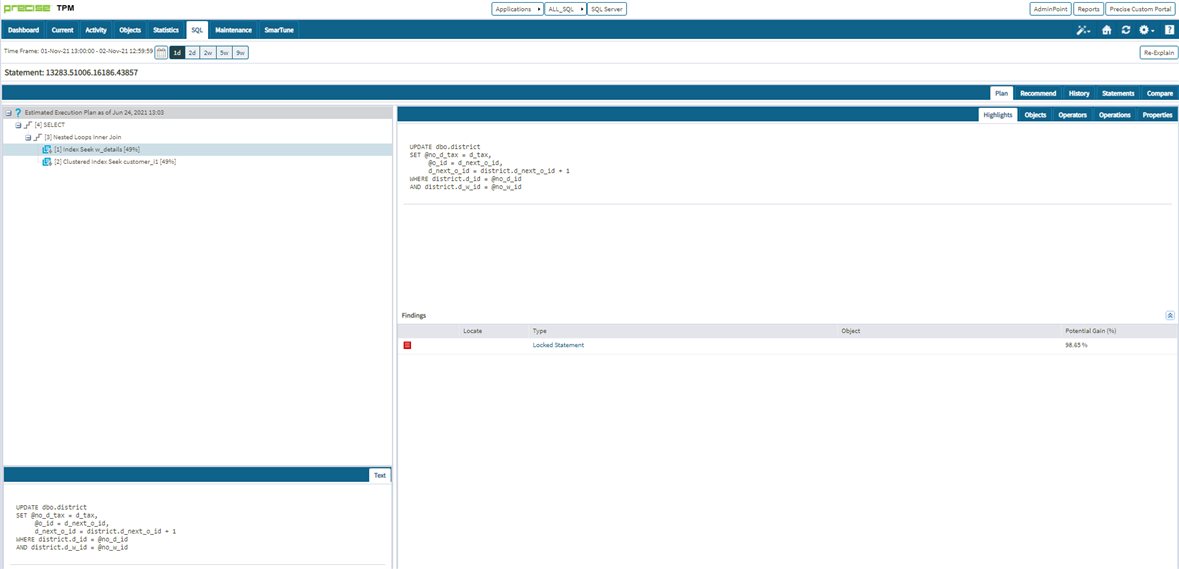
Precise shows you performance issues within SQL statements and provides the ability to diagnose the performance issue such as poor access paths, missing indexes or locking and provides recommendations for fixing them.
Precise shows performance issues related to wait events and allows you to investigate these further
Follow the correct methodology for investigating performance issues in your instance and you will soon have your instance and applications performing better.
Check the following details to find out more about PRECISE
Learn more:
Precise Application Performance Platform
Download and install your Precise V10.3.1 software from here or from the Precise Support Portal.