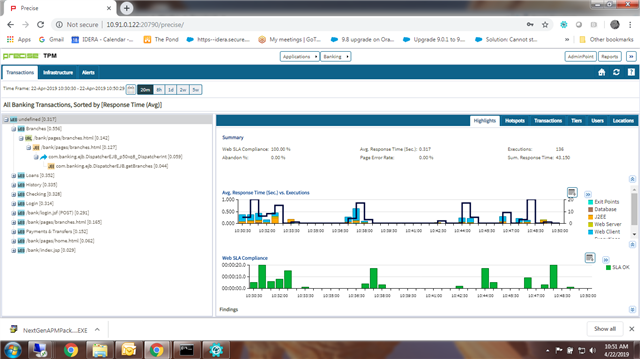
“Res ipsa loquitor” means it speaks for itself. End-user transaction monitoring is Precise’s specialty. This screen shows a list of the slowest transactions in descending order, an over-time graph, and an application tier stacked bar graph. The top right shows the application code step by step through a web service call. Click each image to enlarge and get a better view.

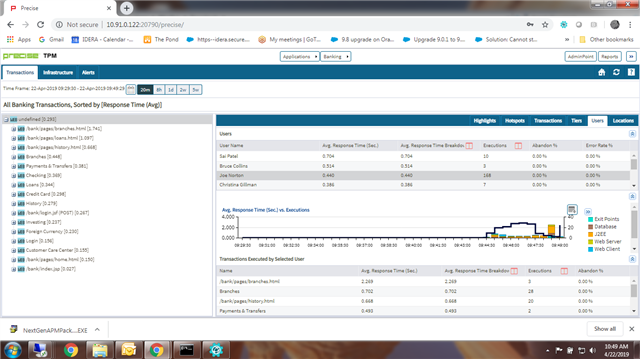
This screen shows end-user experience by log-in ID. Precise can do this for SAP and PeopleSoft too.

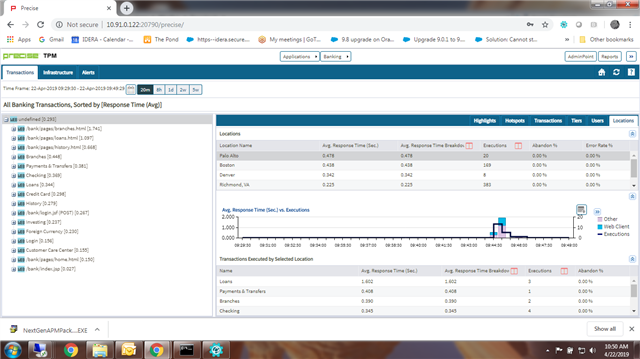
This screen shows performance by location. Location is used primarily to triangulate on a problem beyond the code. One example might be the network.

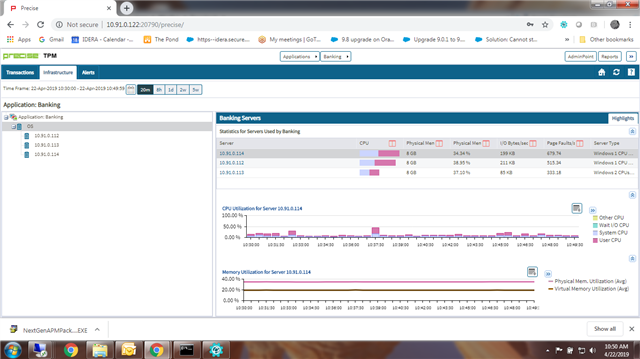
OS metrics show when capacity is an issue and when there is a resource hog. The VMware plug-in does this across a virtualized environment.
