SQL Diagnostic Manager 10.4 will be available soon and it currently available for our beta customers at https://community.idera.com/database-tools/database-management/beta
What’s Coming in Diagnostic Manager 10.4?
This release includes several usability improvements as well as initial support for SQL Server 2019.
- Visual Query Plan in Windows Client. View and diagnose query plans in the Windows Client as well as the IDERA Dashboard browser interface.
- Improved Extended Event Query Plan Collection. Collect configurable top query plans by duration, CPU usage, logical reads or physical writes.
- Query Store Collections. Use Query Store as an alternative collection method for Query Monitor and Query Waits.
- Improved IDERA Dashboard. Exploits Sencha-based grid components for more functionality and improved performance.
- New Alert Grid. Define and save custom filters for alert analysis.
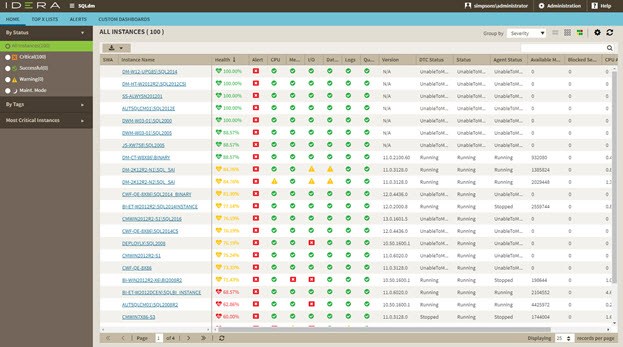
- Instance List Overview. Sortable instance list by Health Index, Alert Status by Category, or specific configurable instance resource metrics.
- Improved Performance – Up to 84% improved load time on some pages.
- Support SQL Server 2019 CTP. Experimental support for customers trying SQL Server 2019 CTP both as a monitored instance and a repository.
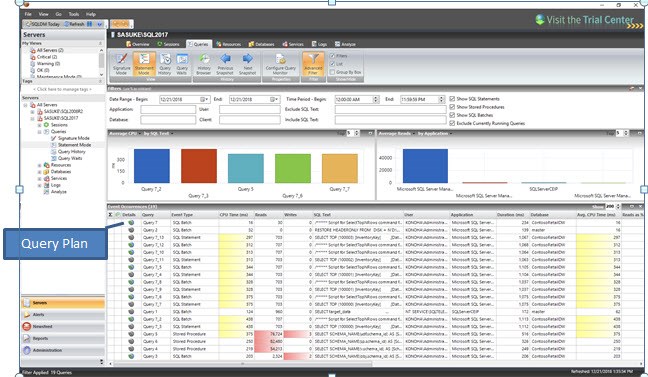
Visual Query Plan
Access the query plan directly from the associated query in either Query Monitor or Query Waits. The icon will indicate whether a query is already collected for the particular query. On-demand estimated plans will be generated for queries without plans collected if possible.
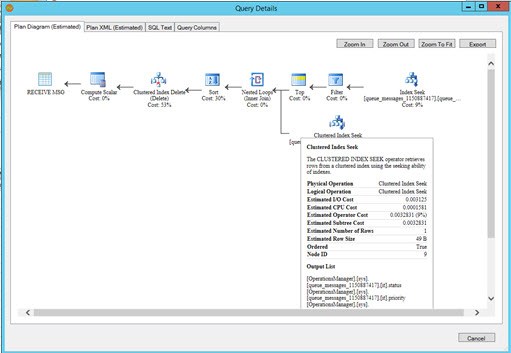
Query Plan Details
Query Plan Details displays the query plan and also provides access to XML, SQL Tex and Query Columns that may be exported.
Query Store Collection
Use Query Store for SQL Server 2016 or SQL Server 2017 to for more efficient collection of query plans and query performance.
Note: Query Wait collections are only available for SQL Server 2017.
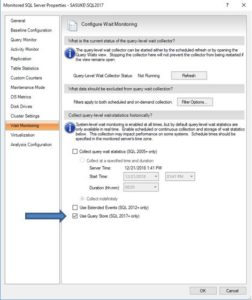
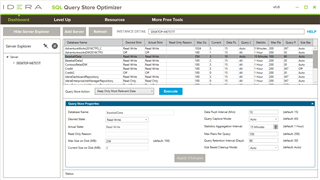
Note: Check out the IDERA Query Store Optimizer free tool to help you enable and configure Query Store.
Improved IDERA Dashboard
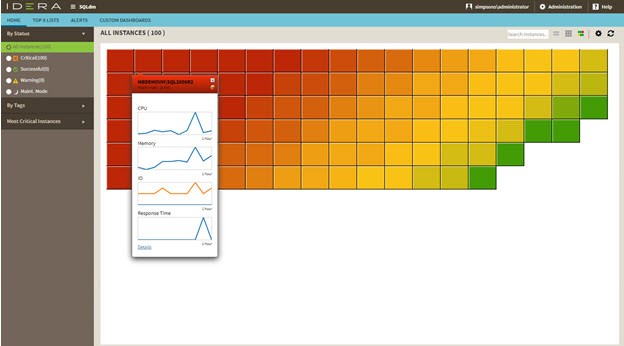
General performance improvements have been made as well as simplified instance overview options and a new Alert Grid with new filtering options for alert analysis.
Heat Map
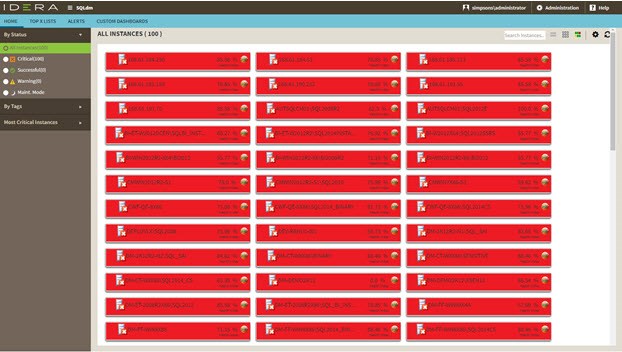
Thumbnail Cards
Sorted Instance List
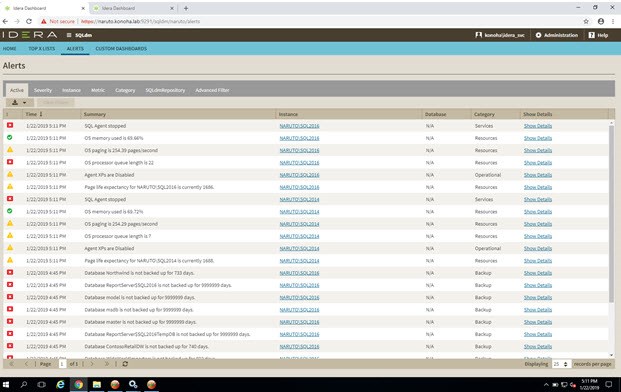
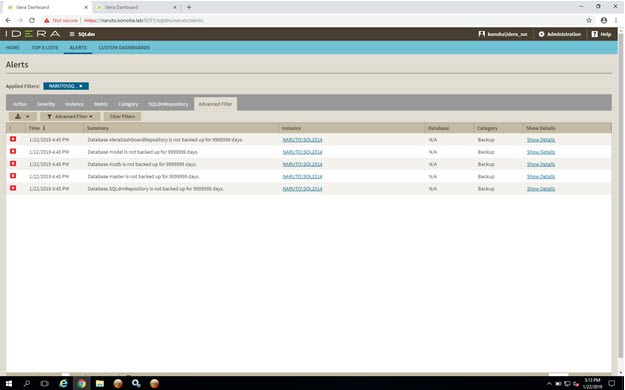
Alert Grid
The alert grid displays more information and may be filtered or grouped by severity, instance, or alert categories.
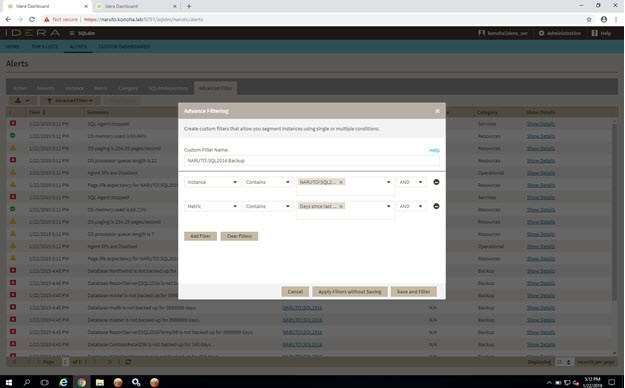
Adding a Custom Filter
Create and save a custom filter for specific ranges of time, metrics, severity, instances, tags, etc.
Filter Applied
Please feel free to give these new features a try and give us your feedback.
Questions or comments? Please let us know in the SQL Diagnostic Manager forum.