We are pleased to announce the general availability of SQL Diagnostic Manager for MySQL 8.7. Existing users may upgrade to this version through the Idera Customer Portal. New users may download the trial version from the Idera Website.
What is SQL Diagnostic Manager for MySQL 8.7?
SQL Diagnostic Manager is the newest addition to the SQL Diagnostic Manager family. Rebranded from the popular Monyog product for monitoring performance of MySQL and other MySQL compatible databases, SDM for MySQL is a comprehensive solution to monitor, alert, and diagnose the availability, health, and performance of MySQL, or MariaDB in physical, virtual, and cloud environments.
Much like the existing SQL Diagnostic Manager for Microsoft SQL Server, SDM for MySQL addresses the most critical performance management needs of DBAs.
- Monitor in real-time to take corrective action and resolve significant issues even before they affect end users
- Track and compare all changes to the MySQL or MariaDB configuration file to identify the reason for performance issues
- Monitor, alert to, and kill locked and long-running SQL queries in real-time to reduce system and database load
- Monitor Amazon RDS for MySQL, MariaDB, or Amazon Aurora including operating systems and file-based logs
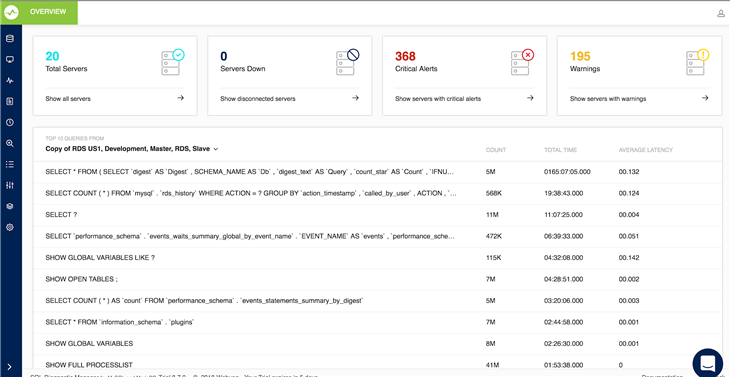
- Find top 10 SQL queries across MySQL or MariaDB servers based on total execution time
Monitor in Real-time
Know what is happening right now on the monitored servers. Monitor each SQL query in real-time and identify what is causing sudden and unwarranted spikes in MySQL or MariaDB databases. Take corrective action and resolve significant issues before they affect end users.
Track Configuration Changes
Find the cause of performance issues. Track all changes made to the MySQL or MariaDB global. Track and compare changes to the configuration file and identify the reason for performance issues.
Monitor Locked and Long-running Queries
Reduce excessive CPU usage and execution times of SQL queries. Monitor locked and long-running SQL queries in real-time. Receive notifications by email, Simple Network Management Protocol (SNMP) traps, the Syslog message logging protocol, the Slack collaboration platform and the PagerDuty incident response platform for SQL queries that take more than a specified amount of time to execute. Kill, notify, and notify and kill problematic SQL queries.
Monitor Amazon RDS
Monitor MySQL or MariaDB hosted in the cloud such as Amazon RDS for MySQL, MariaDB, or Amazon Aurora. Display general query logs, slow query logs, and error logs in a single view. View operating system metrics (such as CPU and RAM usage).
Find Top 10 Queries across Servers
Identify quickly SQL queries that cause performance issues. Find the top 10 SQL queries across MySQL or MariaDB servers based on the total execution time to improve SQL query performance. Visualize critical alerts and warning alerts across MySQL or MariaDB servers to determine the cause of performance issues.
Questions or comments? Please let us know in the SQL Diagnostic Manager for MySQL forum.
