SQL diagnostic manager provides many different views of the data it collects. This lets you explore all available data when diagnosing tricky problems as SQL DM provides many graphs, lists and views to let you explore your SQL environment. It also provides reports on this data. To most of us, reports just means letting us print the data we are looking at so that we can take a printout from SQL DM out to a meeting to illustrate a problem. But SQL DM reports offer more features than just simple printing.
SQL DM provides over 30 reports as well as providing the ability for you to create custom reports. These reports can be viewed and printed within the SQL diagnostic manager console or you can deploy them to Reporting Services so that they can be scheduled, published and archived. In addition, the reports provide great flexibility as to what is shown in a given report. For example, you can control the SQL Server, database time range and exactly what metric you want to show in the Database Statistics report. In addition you can compare the data on the report with data from other databases.
However, SQL DM does more than just provide powerful, flexible printed reports. The reports feature in SQL DM has some little known features that let you dig in and explore the report data. By clicking on hyperlinks in the reports, you can drill into other reports and get more details on the data in which you are interested. When you click on a hyperlink, SQL DM changes the current report to a detailed report focused on your selection. For example, the Enterprise Summary Report which shows the status across all monitored SQL Servers allows you to click on the individual servers to drill into the Server Summary report focused on the selected SQL Server.
Let’s walk through an example: In this case I know that a particular SQL Server is having some space issues. I want to figure out which database is taking up the most space and look at how much it has been growing. This will help me determine if I need to move databases between servers. I will start with the Top Database report focused on the SQL Server in question. This report shows the SQL Server’s databases sorted by various metrics including Data Size, Data Growth and IO Levels.
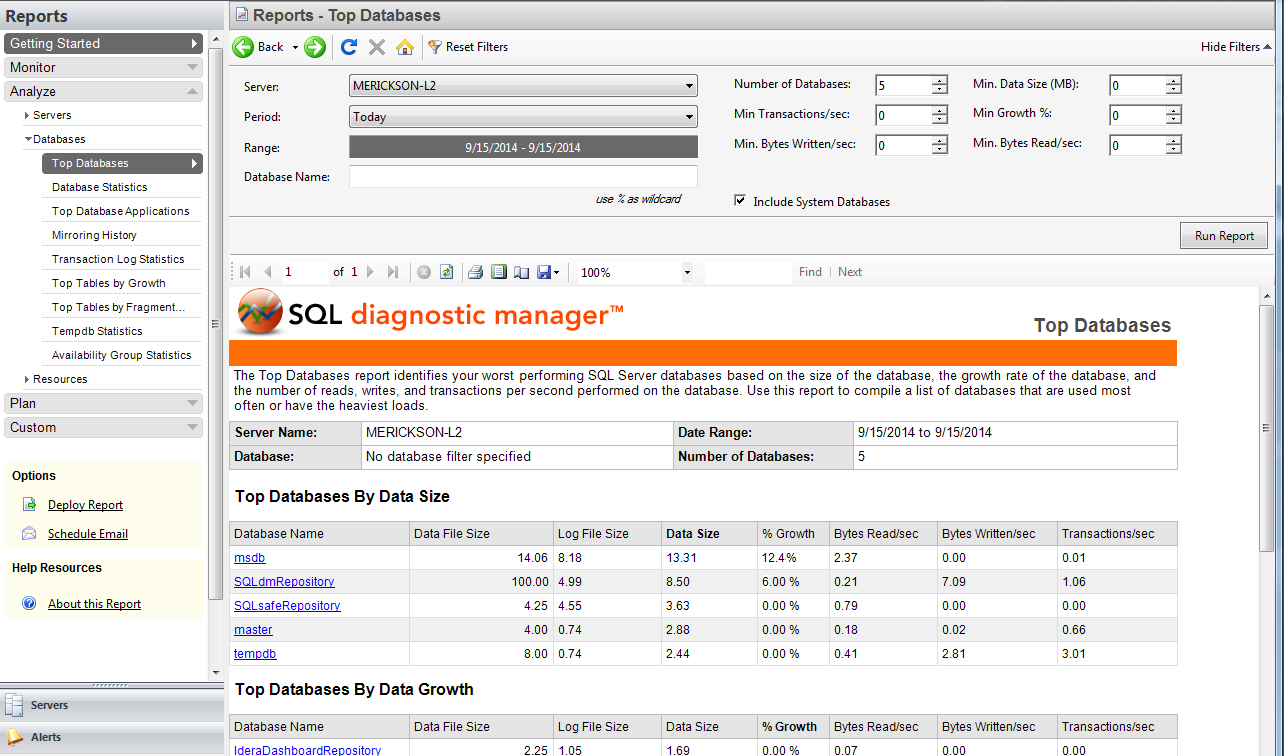
By clicking on the database ‘SQLdm Repository’ under “Top Databases By Data Size” I change the report to focus just on that database. The Database Statistics report shows a graph of the size of the database over time. Here I can explore how much the database size has changed over different periods of time as well as switch between what metric is shown on the graph.
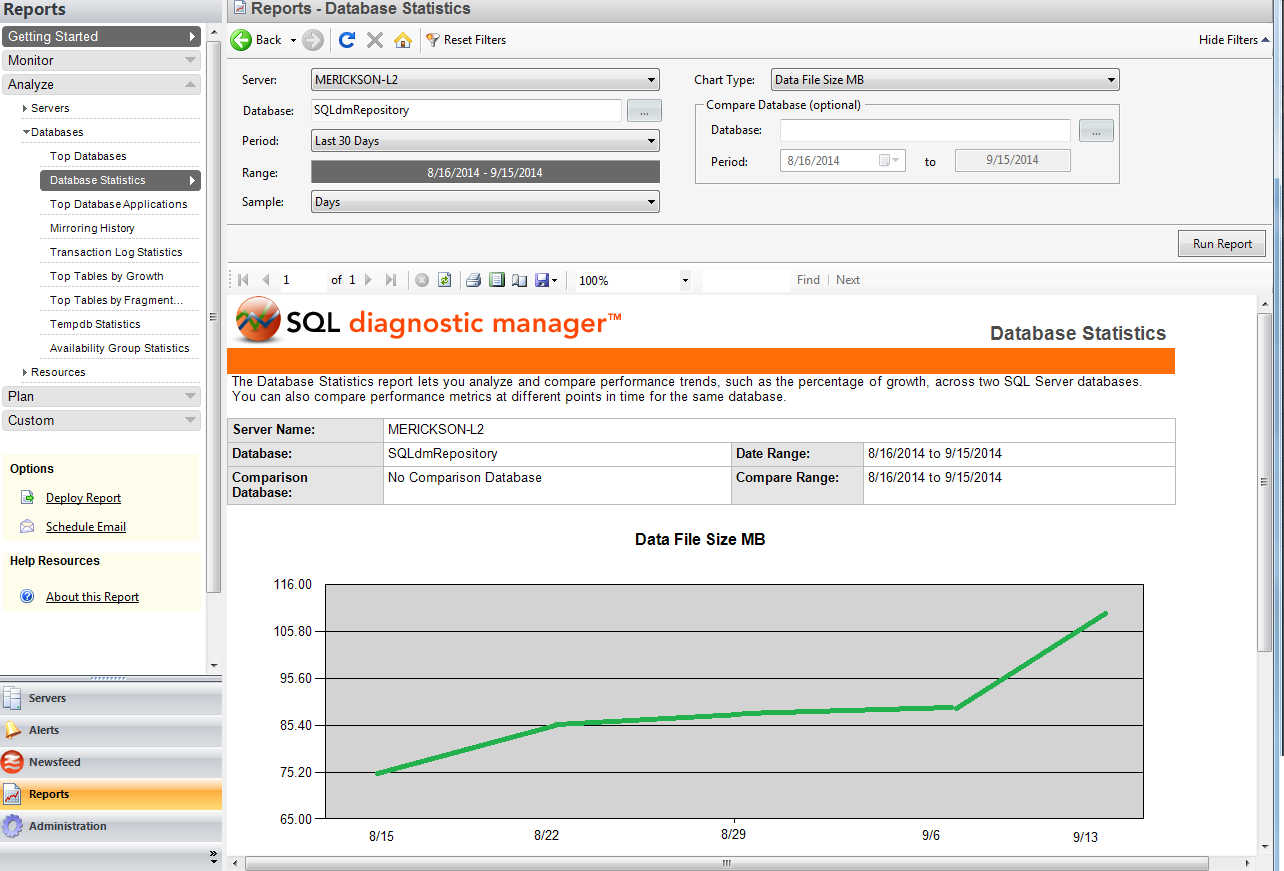
To return to the Top Databases report, I just click the BACK button at the top left of the report. From here, I can drill into other databases to explore them or drill into any of the other available metrics.
This is a simple example but it shows that the reports in SQL DM are designed to do more than just print a graph. They let users explore the report data and drill down to get views on individual problem areas to explore. This can be very beneficial when diagnosing issues.
If you are curious about other features of SQL DM or any other Idera product please let us know!