Idera strives to bring helpful tools to the market for DBAs and Developers to complete daily tasks and a variety of these are free. Today we announce our latest free tool, SQL Heat Map, which displays SQL Server capacity utilization in one simple snapshot view.
A current problem is there is no easy way to visually grasp the used space on a SQL Server. There are times when DBAs or IT staff need to figure out what is using space on a server in order to do effective capacity planning. Heat maps are a creative way to visualize hierarchical numerical data using color coding and relative sizing. SQL Heat Map was designed with this in mind and modeled after WinDirStat. It provides this kind of visual representation and supporting numerical data of a SQL Server to offer an overview of used space.
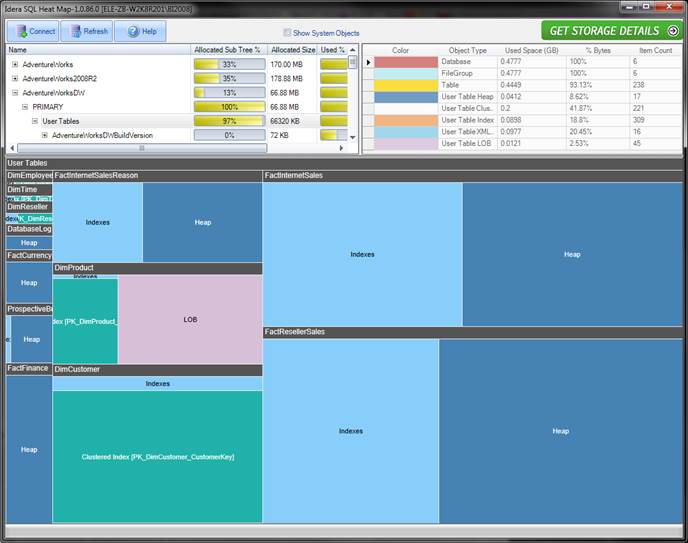
SQL Heat Map consists of a navigation treeview pane, legend grid pane and a heat map view pane for displaying space used details as it applies to how a given SQL Server has organized the data storage (i.e. Databases, Filegroups, Tables, Indexes).
To learn more or to download the tool, visit the SQL Heat Map product page.