This is a guest post from Pinal Dave.
For many DBAs, restless nights start when end users complain that the application using SQL Server is too slow. Most SQL Server workloads begin running slow when the DBA is not monitoring them.
 There are many tools available in SQL Server that help DBAs work effectively. While there are many challenges, DBAs have a number of SQL Server tools to choose from in the market. Some of the common challenging question asked by business and junior DBAs are:
- What are the configuration changes I need to make for new servers?
- When were the database objects deleted?
- Who is using the memory on the Server? Why is SQL Server not releasing all the memory? What components I need to track?
- Who are the people connected to SQL Server now?
- What are the locks on the system that is slowing down my system?
These questions go on-and-on. There is no end to such basic requirements. This article introduces you to the standard reports available with SQL Server Management Studio.
Context for Reports – Server Level
To access SQL Server Management Studio – Server Level reports, Right click on the Server Node -> Reports -> Standard Reports -> Report of your choice. This set of reports have been with SSMS since the SQL Server 2005 days. These reports get enhanced with a few reports added with every release of SQL Server.
There are close to 23 different reports that are worth to mention. For simplicity sake we would like to group them into 3 different categories and will take a quick tour of few outputs too.
Current Activity State
We would like to categorize the following 12 reports from Management Studio under the current activity. The activity monitoring involves understanding the current sessions, open cursors, Top transactions, blocking transactions and much more.
- Memory Consumption – Which components are using Memory on this instance?
- Activity – All Blocking Transactions – Blocking transactions at the server level for all DB’s.
- Activity – All Cursors – Current Open Cursors on the instance.
- Activity – Top Cursors – Same as above but ordered on resource.
- Activity – All Sessions – Current sessions running and open.
- Activity – Top Sessions – Same as above but sorted on resource utilization.
- Activity – Dormant Sessions – Current dormant sessions on the server.
- Activity – Top Connections – Shows list of connections maintained on the server.
- Transaction Log Shipping Status – Shows the status of current Log Shipping configured on the instance.
- Top Transactions by Age – Lists transactions by time.
- Top Transactions by Blocked Transactions Count – Transactions by blocking count
- Top Transactions by Locks Count – Sort transactions by number of locks held.
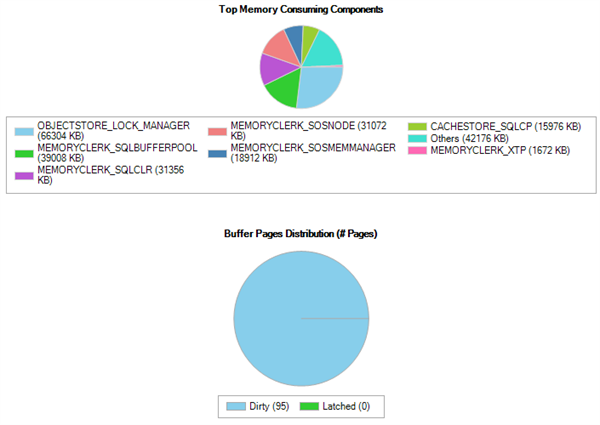
Let us take a simple example for the common question of what are the components that are consuming memory inside our servers. This is available from the Memory Consumption reports.
The sample output shows how the components of Lock Manager, SQL Server BufferPool, SQL SOS (SQL OS) and other components consuming memory. This is a great starting point if we are facing any memory related issues. Additional information available for each of these components include Allocated Memory, Virtual Memory Reserved, and Virtual Memory Committed, AWE Memory and Shared memory.
Performance Related Reports
If you are working with SQL Server or any database for that matter, it is inevitable that we are troubleshooting some performance related problems. The fundamental building blocks generally involve around memory, CPU and IO (Reads and writes). These standard set of reports bring some of these facets making reactive or live performance tuning easy.
- Performance – Batch Execution Statistics – Shows batches based on CPU, Logical Reads and Writes.
- Performance – Object Execution Statistics – Same as above but shown per database Object.
- Performance – Top Queries by Average CPU Time – Shows queries sorted on CPU time
- Performance – Top Queries by Average 10 – Shows queries based on resource utilization.
- Performance – Top Queries by Total CPU Time – Shows queries sorted on CPU time
- Performance – Top Queries by Total 10 – Shows top 10 Queries based on resource utilization.
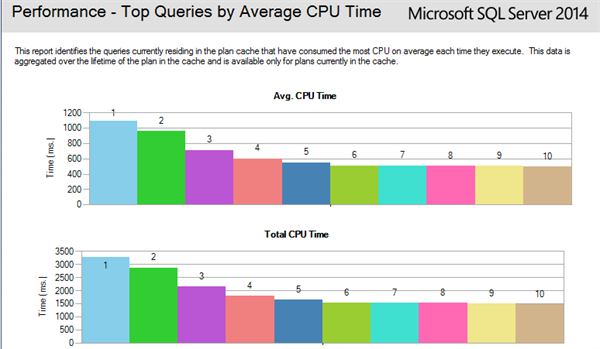
Let us take a simple workload on the server and if we are to troubleshoot high CPU on our servers, then we can query the “Top queries by Total CPU Time”. This will give us the Top 10 queries in both graphical view and list view. A sample output for the same looks like:
If you are looking at,
- Which are the queries consuming high CPU since server start?
- How many executions were done by our highly inefficient queries?
- When these queries were executed last time? This can be useful for cases when these are from a report.
- How many reads and writes were done by each of these executions?
These are sample questions that can be easily answered by the CPU Time reports.
Miscellaneous Server Health Reports
This is the third category, we would like to add the rest of the reports into this category. Having said that, some of these reports are powerful and a must even for proactive monitoring.
- Server Dashboard – Shows the overall health of the current instance.
- Configuration Changes History – Shows Configuration changes for the current instance.
- Schema Changes History – Changes made on Server level like DB drop, objects drop etc.
- Scheduler Health – Shows the number of scheduler currently operating with additional info.
- Service Broker Statistics – Reports to monitor Service broker implementation.
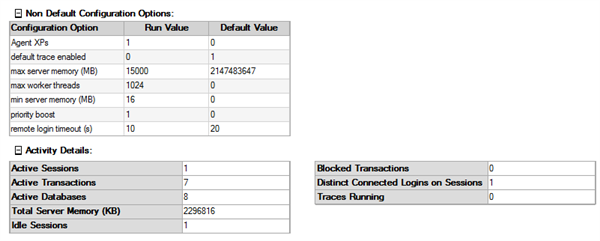
As mentioned above, the first report that every DBA must look at when configuring / troubleshooting any environment would be the “Server Dashboard”. In the real sense this is a dashboard of configuration changes on the server instance. We ideally look at some of the hidden values like:
Any change in configuration is worth a note here. In the above example, we can see the Memory is being capped at 15GB, default trace is off and so on. These are critical information that any DBA needs to know as soon as they troubleshoot a new environment.
As we dissect and explore more from each reports, we highly recommend to play around with these standard reports in your environments to see what values are sent out. There is yet another set of reports available on the Database Level which can give details at a specific Database level.
Conclusion

Next Steps
Learn more about Embarcadero DBArtisan, the premier cross-platform database administration solution, and try DBArtisan for free.


