The Extended Events technology added to SQL Server in SQL 2008 and expanded upon greatly in SQL 2012 is a powerful mechanism for monitoring activity in SQL Server. It has huge implications for tools like SQL Diagnostic Manager, which switched over to XEvent technology for wait monitoring, and for users of all stripes who need to see what is happening on their servers.
Unfortunately, in SQL 2008, the XEvent technology was not quite fully ready for the average user. It offered a reduced set of events and could only be manipulated through TSQL. In SQL 2012 the number of events went up dramatically and Microsoft released an XEvent GUI as part of Management Studio. However, what we’ve heard from users is that the XEvent tool is a bit overkill for a lot of purposes. Therefore, a lot of users continue to use SQL Server Profiler, which uses trace technology. It’s easy to see why – it’s familiar, it’s easy to use, and it takes only a few clicks to get a diagnostic session started.
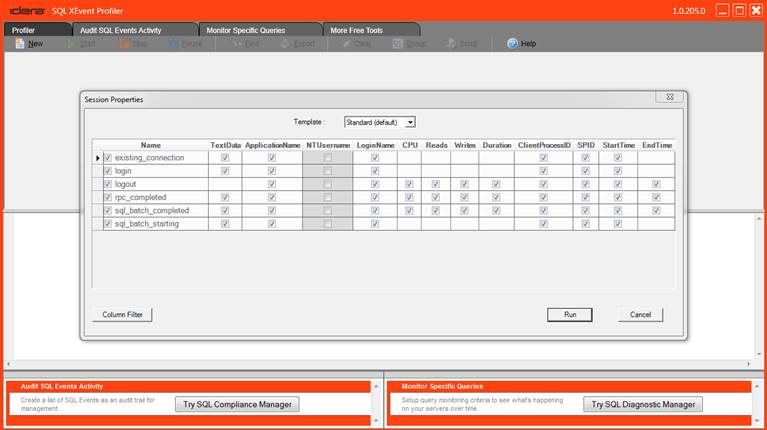
With that in mind, we’ve put together a new free tool called SQL XEvent Profiler, which offers the simplicity of Profiler but uses the powerful and lightweight XEvent technology on the back end. The idea was to provide the simple 2 click behavior that users were looking for, along with the familiar SQL Profiler templates that users are already accustomed to using.
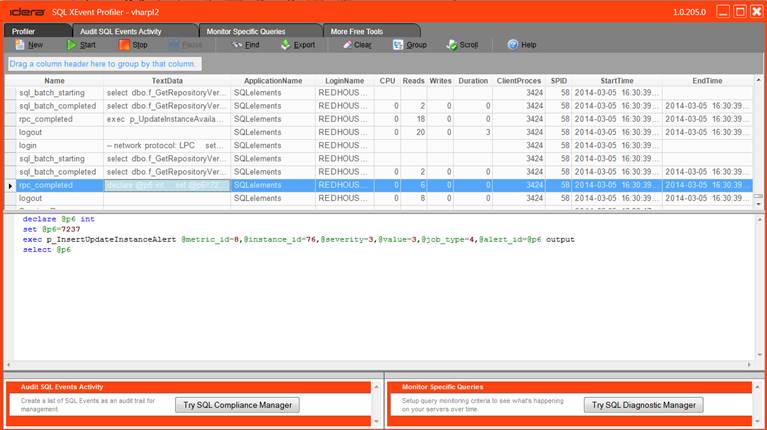
The application has the familiar start, stop, and pause buttons, the ability to turn auto-scroll on and off, and the ability to clear the grid. While we were at it, we added some nice grouping functionality to the event grid, along with text searching and export.
Working on this tool was fun and interesting for the team and we hope you find it useful. It’s available to download for free at the Idera website.
Thoughts, comments? Ideas for another free tool? Let us know!

