Next in our Benefits of SQL Diagnostic Manager for MySQL blog series, we discuss monitoring and understanding performance trends using visual analytics and the display dashboard of SQL Diagnostic Manager for MySQL. If you missed it, you can read last week’s blog on identifying and analyzing problematic SQL queries.

View and Understand Trends By Analyzing Historical Data
Configure the time duration for storing the data collected by SQL Diagnostic Manager for MySQL. It stores the data in a high-performance database (that is, the embedded relational database management system SQLite). By analyzing historical data, quickly obtain answers to questions like:
- How many times and when did database servers go down during the last six months? Which day of the week has maximum database activity?
- How many time and when were logins attempted with incorrect passwords yesterday?
Sudden changes in performance parameters and problems (such as due to a change of application) will also be visible immediately.

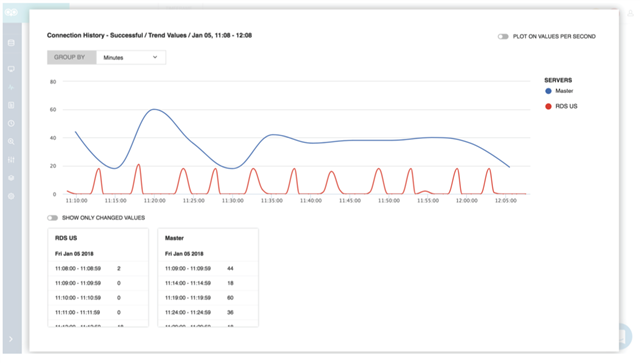
SQL Diagnostic Manager for MySQL provides trend graph analysis that makes it easy to compare the state and performance of multiple database servers in a single chart. Group an important single metric from different database servers into a single unified chart. Visually analyze a metric across database servers at various points in time.
Display Dashboard Overview
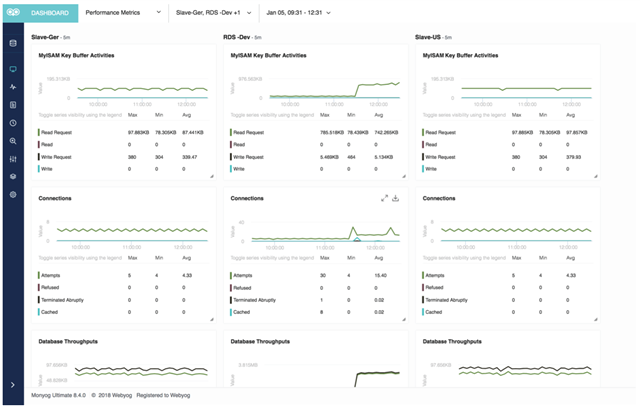
One of the most significant challenges database administrators face is managing an ever-growing number of database servers and databases. Regardless of the size of the database environment, each database server requires specific attention when it comes to necessary administration, security, performance monitoring, and availability. To provide database administrators for MySQL and MariaDB with a proactive advantage, SQL Diagnostic Manager for MySQL provides the Dashboard web page feature. It lets database administrators determine the cause of a performance spike by zooming in on it and viewing the SQL queries for the time frame of the spike. The design of the dashboard is such that database administrators easily understand the complete security, availability, and performance of all of their MySQL or MariaDB servers in a single place, all from a modern and intuitive web interface based on asynchronous JavaScript and XML (AJAX).
Unlike other monitoring tools for MySQL and MariaDB that use annoying web page refreshes for real-time charting, SQL Diagnostic Manager for MySQL uses charts based on JavaScript to ensure the display of true real-time charts.
Compare Large Number of Servers Side-By-Side
The Enterprise Dashboard feature shows real-time charts of all critical metrics. It provides a consolidated view of the availability and performance of all MySQL or MariaDB servers. From these real-time charts, instantly determine:
- The availability status of all database servers
- Essential operating system metrics that may be affecting database servers Which database servers need attention
- Where and how they need to spend their limited time
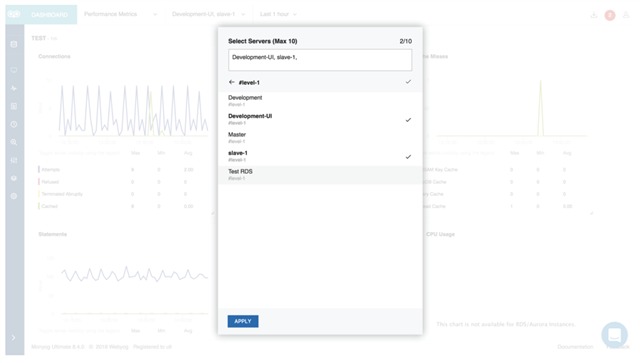
It is not rare to find database administrators who monitor hundreds of database servers. With SQL Diagnostic Manager for MySQL, managing a large number of database servers is easy. With tagging, categorize database servers into logical groups. Monitor a large number of database servers using a single instance of SQL Diagnostic Manager for MySQL.
Read more in the full solution brief.
Find and fix MySQL performance problems on-premises and in the cloud with SQL Diagnostic Manager for MySQL.

