MySQL SHOW Commands
Different database vendors provide different ways of querying the engine to determine status, sessions, configuration, and other important information.
With Microsoft’s SQL Server, this is done with the “dynamic management views” and “dynamic management functions.” Anyone who has worked with SQL Server for a period of time has learned that the views, such as sys.dm_os_performance_counters, sys.dm_index_usage_stats, and sys.dm_exec_sessions provide a way of reading information about database performance and bottlenecks. Similarly, Oracle has a large number of V$ and GV$ tables that provide similar information.
What’s the equivalent in MySQL? The SHOW commands. These are commands, not SQL queries, that provide in-depth information about the database, objects, sessions, and execution of statements. There are over 40 different forms of the SHOW command. You can see them here. Below are a few that provide key information:
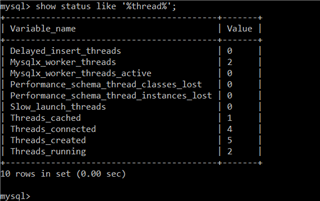
SHOW STATUS
This command can show hundreds of statuses, including thread connections, uptime, locks, sort rows, and others. Information here can be used to troubleshoot replication status, long locks, long-running threads, and so on. By default, this command returns hundreds of rows. You can use patterns to retrieve specific variables.
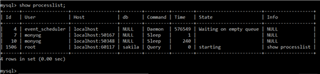
SHOW PROCESSLIST
Information about users, connections, currently running SQL, and state can be checked with this command.
SHOW [ERRORS/WARNINGS]
Errors and warnings are written to the MySQL error log. They can be queried through this SHOW command.
As stated earlier, there are 40 different forms off the SHOW command, each providing dozens or hundreds of pieces of useful information. If you are a DBA new to MySQL, which of these do you learn? How do you capture and report on these statuses? And how do you look at these values over time, when the queries return a snapshot of what’s happening at the moment?
Idera’s SQL Diagnostic Manager for MySQL does all of this for you. Not only is it automatically retrieving information from these commands, it is storing the results for (by default) a week. Through dashboards, monitors, and other graphs, you can see cache hit ratios, deadlocks, CPU spikes, or large numbers of failed connections, all of which come from the SHOW commands. And instead of just seeing the current status, you can see how these values are changing over time.
A free trial for SQL Diagnostic Manager for MySQL (located here) has all of the knowledge of an expert-level DBA built into it. It’s the standard for MySQL monitoring.