


So I recently began working on a project for a client that wanted to move from a Premium Elastic Pool to a Standard Elastic Pool due to the costs. They wanted to know if it was possible, and asked me to provide expert advice and steps to accomplish this. So, now that the project is nearly completed, I thought I should share the plan we used and take it step by step.
First, I had to evaluate their Premium Elastic Pool that was currently being used. Several of their databases were pretty large and would not fit into any GA Standard Pool sizes. When I began to research the pool sizes that were in the preview status, I found this lovely disclaimer: “PREVIEWS ARE PROVIDED “AS-IS,” “WITH ALL FAULTS,” AND “AS AVAILABLE,” AND ARE EXCLUDED FROM THE SERVICE LEVEL AGREEMENTS AND LIMITED WARRANTY.” That was found here: Azure Disclaimer. When I explained to my client that currently there were no Standard Elastic Pools for them to migrate to that were not in preview, they decided to have me work on their code instead, in hopes that by the time we identified troublesome queries and had them tuned, the pools would be out of preview. His Director would not approve the migration to a Standard Elastic Pool that was in a preview status since it was a production environment and needed the standard Azure SLA.
So, how did I find the troublesome queries you ask? Simple! First, they are already using an Elastic Database Pool(Find more info on these here: Elastic Pools). I could simply login to the Azure Portal and view that Elastic Pool eDTU usage. So, that is exactly what I did. I found the top 5 highest utilization databases, and drilled into each individually. Since the client was moving from a Premium Elastic Pool to a Standard Elastic Pool, the biggest difference was going to be IOPS. Premium Elastic Pools run on SSD storage, while Standard Elastic Pools utilize network-attached storage(ISCSI). So the way I approached was this: Utilizing QPI(Query Performance Insight, info here: QPI Info), identify the highest DATA I/O and LOG I/O utilization queries and do what I could to reduce their usage there. This way when they moved to the Standard Elastic Pool, their load was already reduced.
To access QPI, you simply need to click on the database you want to work with. Once you click on your database, scroll down in the portal to Query Performance Insight(QPI). Once QPI opens, you will see three options to sort on: CPU, DATA I/O, and LOG I/O. You can also set the timeframe to view, I set for 24 hours. Now, I have my timeline of 24 hours, and I am able to view which queries had the highest DATA I/O. I made a list of the top 3 from each category(CPU, DATA I/O, and LOG I/O) and presented it to my client. I presented the number of times it was executed, and the usage it utilized each time(all from the QPI information). The client then sent me 10 queries they wanted tuned and listed them in a prioritized list.
Well, by the end of tuning their 3 highest priority queries, we removed over 10 billion logical reads! Yep, 10 BILLION! The client was very happy with our results and is currently awaiting the preview Standard Elastic Pools to come out of Preview and become GA. I have provided a few screenshots of an AdventureWorksLT database on my personal instance just to show you how to access QPI, and change metrics. Thanks to Bill aka Wolf for the query tuning portion(B/T)
Demo
So first thing first, make sure you have a database on your DBaaS instance. I do not have an Elastic Pool, but the QPI location is the same whether you have an Elastic Pool or not.
1. Once your database is selected in the Azure Portal, scroll down in it’s menu options to the Query Performance Insight option, then click it.
![]()
2. This is what the main QPI page will look like when you have a database that is not highly used(IE. My AdventureWorksLT database)

3. I wanted to see the highest DATA I/O queries, so I clicked on the DATA I/O option on the left side of the QPI window.
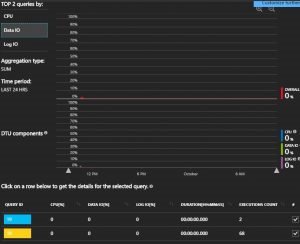
4. I then chose the yellow query because it had the higher execution count of the two, and since the goal of the project was to try to eliminate as much DATA I/O as possible.
![]()
5. When you get to the next page, you should see the following options along the top edge of the window.

6. You should also see something similar to the below screenshots(Top is the top, and bottom is the bottom. Had to split into two screenshots as it would not all fit in one!)
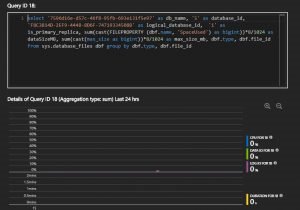
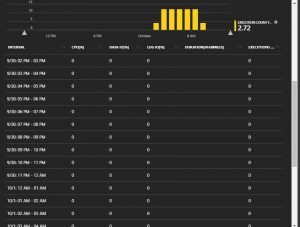
With this information, I can see the query text of the code that is causing the high data usage, and I can see the metrics of EACH execution! Pretty simple right?
Summary
Once the project completed, the client was extremely happy with the results, we reduced the DATA I/O in his Premium Elastic Pool by around 7% overall. The QPI is a fantastic tool to use to quickly identify your higher performance queries. There are other options in there as well and I encourage all of you to look around in there, and let me know what you find! Thanks for reading!