When deploying SQL Diagnostic Manager for the first time, it may be necessary to register several SQL Server instances that are to be monitored by the tool. While it is possible to register several instances using the GUI, there is another option that’s available thanks to the SQLDM PowerShell Snap-in. In this post, I’ll demonstrate a simple example of how the SQLDM PowerShell Snap-in could be used to register several instances.
The SQLDM PowerShell Snap-in has a number of different cmdlets that are available, which are documented within the SQLDM Online Help. Each available cmdlet serves a different purpose, which can help with automating and managing environments both large and small. The specific cmdlet that I'll be using is the New-SQLdmMonitoredInstance, which provides the ability to register a monitored instance.
The online help provides two different examples of the New-SQLdmMonitoredInstance cmdlet.
New-SQLdmMonitoredInstance -Path Instance1 -WindowsAuthentication -tags production,finance,critical

New-SQLdmMonitoredInstance -Path (Escape-SQLdmName -Name ServerA\Instance1) -Credential sa
For this demonstration, I'll be using the second of the two examples since it supports both default instances and named instances.
The first thing that I need to do is to start a spreadsheet which I'll use to create the specific commands that I'll need to use to register each instance. To keep this demonstration simple, I'll only have two different columns. The first column will be the list of instances that I want to register. The second column will be used to create the PowerShell command.

To create the PowerShell Command, I'll be using the CONCATENATE function. In cell B2, I enter the following formula which will then be copied to the other cells in the B column.
=CONCATENATE("New-SQLdmMonitoredInstance -Path (Escape-SQLdmName -Name """, A2,""") -WindowsAuthentication")
When I'm done, I would have quickly and fairly easily created all of the PowerShell commands that I need to register my instance.
With the commands generated, I then copy the commands into a text file that will be used to create a PS1 file. In the PS1 file, I'll add a few extra lines that will basically get the SQLDM PowerShell snap-in loaded and configured so that the registration of the instances succeed. For more information about these added commands, you can visit the Use PowerShell to automate SQL Diagnostic Manager functions topic in the SQLDM Online Help. My resulting PS1 file is shown in the image below.
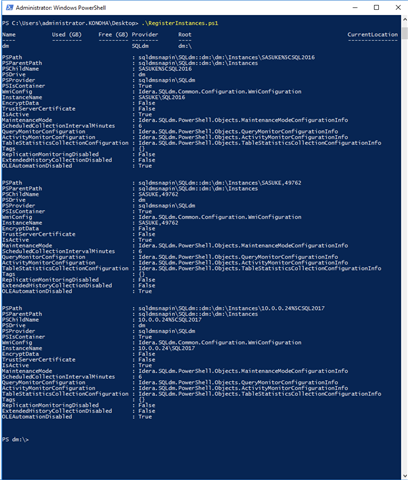
At this point, all I have to do is open PowerShell on the server where SQLDM is installed and run the PS1 file.
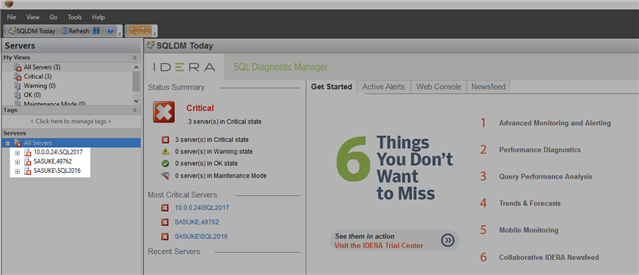
In the SQL Diagnostic Manager Desktop Client, I can confirm that my instances were registered successfully.
The New-SQLdmMonitoredInstance cmdlet has a number of different parameters that are available. For example, you can configure the interval at which SQL Diagnostic Manager collects diagnostic data from the monitored instance, enable/disable Query Monitor, enable/disable maintenance mode, and much more. It's certainly possible that this example is extended to include other parameters for a highly customized command. For more information about the available parameters, you can use Get-Help.
To see the examples, type: "get-help New-SQLdmMonitoredInstance -examples".
For more information, type: "get-help New-SQLdmMonitoredInstance -detailed".
For technical information, type: "get-help New-SQLdmMonitoredInstance -full".


