


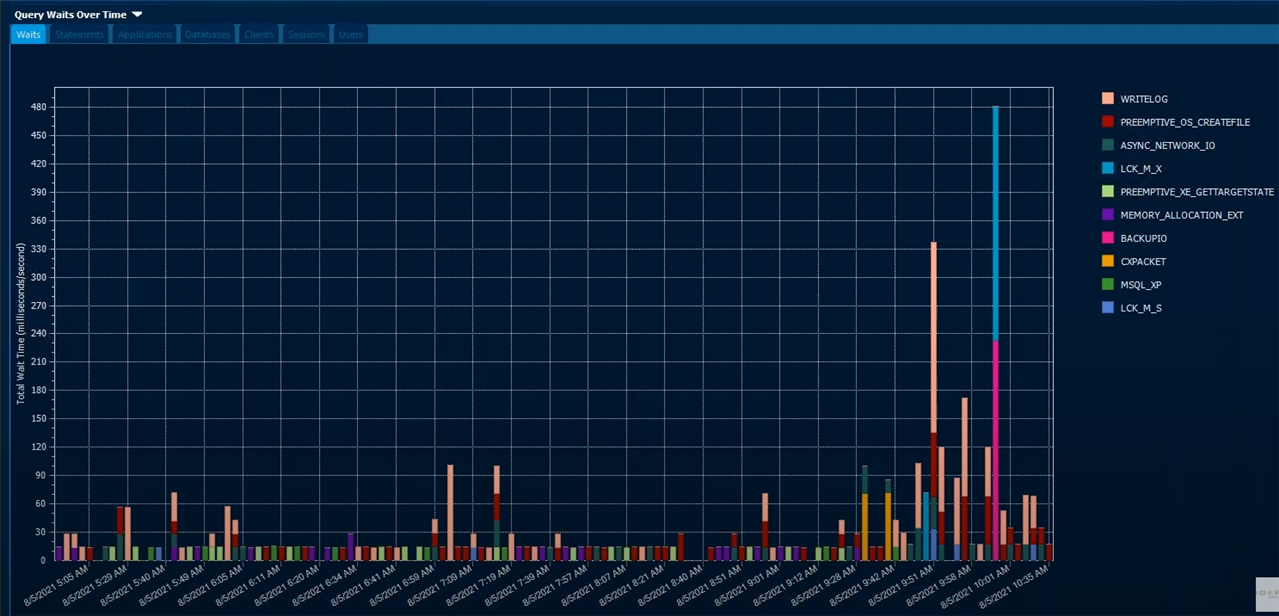
There are several things that could cause performance issues for a query. You can identify these by breaking down the processing time for a query into various wait states, such as locks, input/output, and the central processing unit. This can give you an idea of what steps you might take to improve the overall performance or for a specific statement. In the screenshot below, we can see a breakdown of wait times for various time periods.
SQL Diagnostic Manager then lets you drill into the specified time to get a sense of queries that were running and identify what problem queries need to be reviewed.
For more information, please refer to the solution brief “Keep your SQL Servers running smoothly with SQL Diagnostic Manager” by Greg Robidoux from MSSQLTips.