 Being normal may not seem like much fun; I wore a “Why Be Normal?” button with pride throughout college. And I did it out of choice rather than as a piece of required flair.
“People can get a cheeseburger anywhere, okay?
They come to Chotchkie’s for the atmosphere and the attitude.
Okay, that’s what the flair’s about. It’s about fun.”
But in the world of database performance, “normal” is a highly prized goal. It means nothing extraordinary is happening that requires intervention or diagnosis. It means no fire-fighting or frantic finger-pointing exercises across functions in the IT department.
So, in this case, normal is the goal. Normal performance means normal service levels and minimal drama from dissatisfied users and customers. But to be measured and monitored, “normal” must first be defined and measured and that is sometimes more easily said than done.
If you have attended any best practice presentations or courses for DBAs over the years you have undoubtedly been told the first step in measuring and monitoring performance is to establish baselines. The trick is that different people throw that term around without definition while meaning very different things. So I want to discuss some of those meanings and then explain what it means in the context of monitoring tools. And even in that isolated context of monitoring tools you need to understand how different vendors use the same term
What is a baseline anyway?
So, what do consultants mean when they advise you to “take a baseline” as a first step to monitoring and improving performance? At its most basic definition, a baseline is any starting measurement you take to evaluate future changes against the same. It doesn’t have to representative; it doesn’t have to be taken over time. But if you want it to be meaningful then you will want to do more than take a single measurement and call it your baseline. You will want to take it at an appropriate time when you will want to compare future measurements and you will want to take multiple measurements to make sure you don’t have an “outlier” as your baseline.
The best way to accomplish this task is to take many measurements and evaluate those measurements statistically to determine a “normal” operating range for your system. Of course, you need to make sure you take these measurements when the overall performance is acceptable to you. You don’t want your “normal” to be “abnormal” from your users’ perspective.
Anomaly detection
Every performance monitoring product is ultimately seeking to provide anomaly detection. But it can mean an anomaly from different things. The most basic monitoring allows you to detect deviation from some best-practice default settings for performance metrics. The performance metrics are identified as leading indicators of overall system performance. And the key is to detect problems early, before they start affecting user performance or impact service level agreements.
The downside to this sort of basic anomaly detection is balancing between the danger of missing problems ( false negatives ) and the overhead of managing too many false positive alerts. False positives means the alerts are overly cautious and generating warnings when no real underlying problem exists to solve.
Experienced DBAs who have used monitoring systems over many years develop their own “best practice” settings for alerts based on:
- Personal tolerance for risk of missing a real problem
- Knowledge of the behavior of different sorts of applications and particular instance performance
- Criticality of the particular application or system to the business itself.
Tuning alert thresholds in this manner can be more of an art than a science. And even experienced DBAs may not have the complete familiarity with every instance under their care to know the right balance to strike immediately. They need to watch performance over time and manipulate thresholds gradually. They will usually establish a template of thresholds for a particular set of instances based on different combinations of the three criteria listed.
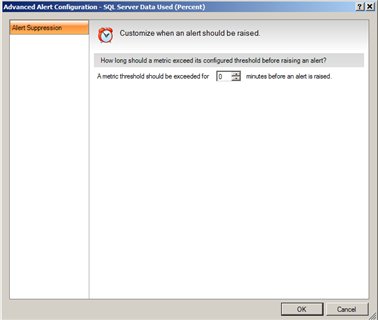
When manipulating simple thresholds is insufficient, the DBA may resort to some sort of filtering or alert suppression such as the following example to filter out temporary spikes:
SQL Diagnostic Manager also permits filtering out alerts on particular databases or files or disks that may be unimportant to the DBA for one reason or another.
But ideally we would like to auto-calibrate these threshold tuning adjustments as much as possible to minimize the need for extreme experience with every application and instance behavior and the trial-and-error process for setting and adjusting these threshold template settings.
Baseline approaches
Many monitoring products claim to automate the baseline measurement function but not all of them are referencing the same thing with the term. They all either plot a reference line or a range of values and leave it to you to assign a meaning to that range. I hope to correct that to some degree with this blog post, at least for IDERA customers.
The title of this blog purposely references the desire to measure and monitor “normal” behavior in a database instance. But just because you see a metric plotted against a range of values doesn’t necessarily mean the range represents what is normal for your database instance.
“What is normal” versus “What is extreme”
The easiest way to determine a range of values for comparison to a current value is to use minimum and maximum values. If you save minimums and maximums over a period of time then you can use it to construct a range for a particular time of day or day of the week. It looks really cool to plot this changing range over a period of time and compare it to your current readings.
But what looks good on a graph can be counter-productive if used for managing a system or used as an alerting threshold. In effect, you are allowing your points of comparison to be determined exclusively by outliers. A metric with very little variance but infrequent wild spikes or dips will be treated the same as an extremely noisy metric.
You don’t need much of a background in statistics to recognize that using historical outlier values as an approximation of normal behavior for a metric is misguided at best and misleading at worst.
Does “normal” mean Gaussian?
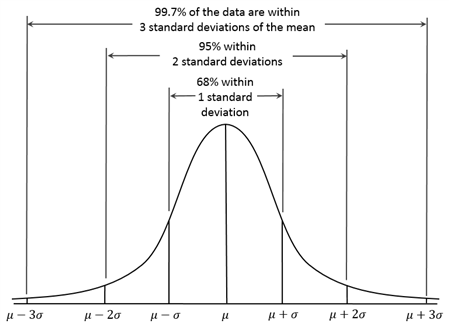
So, we need a better representation of normal variance of any given metric than just keeping a history of maximum or minimum values. The Gaussian or Normal distribution is often used in natural and social sciences to represent random variables whose distributions are not known. The reason is that, given the right restrictions, experimentation usually proves out this assumption.
Anyone who has attended school will be familiar with the old bell curve regardless if you know it by its other names. (I was always amazed that a histogram of grades of any sufficiently large class, at any level, seemed to conform to this familiar shape. The central limit theorem works!) As a refresher, the key values here are the mean and the standard deviation. The standard deviation determines the shape of the curve and the mean determines the position of the curve. Using only the upper thresholds of the distribution (we usually only care about performance metrics if they are abnormally ‘bad’, not abnormally ‘good’), we can estimate that 84% of the time the metric should stay under the mean plus one standard deviation and 97.5% it will stay under two standard deviations.
So, does the distribution apply to the behavior of database or system performance metrics over time? The answer is that it doesn’t need to apply directly for the probability distribution to be useful. It only needs to apply to the error or noise component of the metric when predicting future behavior. If there is a long term trend or cyclical nature to the value, then after removing those factors you will be left with a normally distributed variable.
In a time-series metric like we use for performance monitoring, we can correct for trends by using a moving window of time for our calculation population. And we can correct for cyclicality by using different calculations for times when we observe different performance because of changing load on the database or system.
Using calculated baselines in SQL Diagnostic Manager
For certain metrics, SQL Diagnostic Manager uses these assumptions about the mean and standard deviation to calculate more useful baselines. These help you calibrate your alert thresholds to the behavior of your particular environment or alternatively you can use them directly for your alerts.
What does “default” baseline mean anyway?
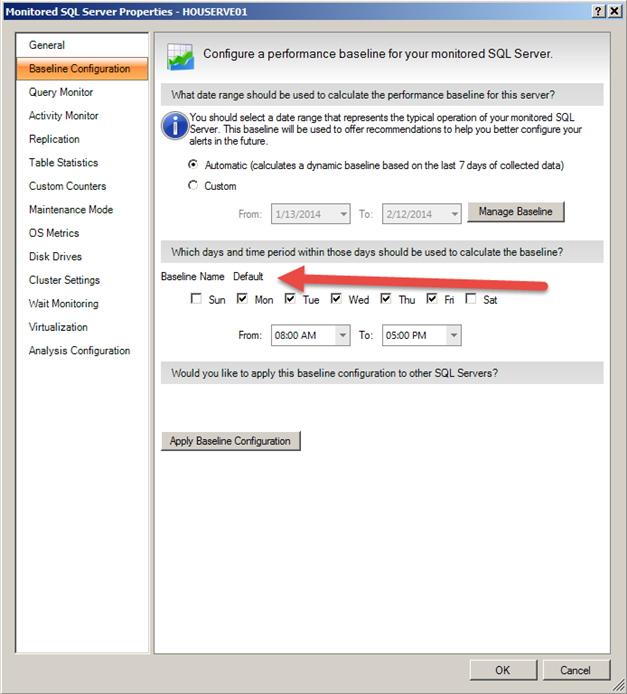
Prior to the release of SQL Diagnostic Manager 10, there was only one performance baseline calculation. Now, that calculation is the named as the default while the user can add as many named baseline calculations as desired. The default calculation period can also overlap with any other baseline period.
The “default” baseline is used uniquely in a few ways:
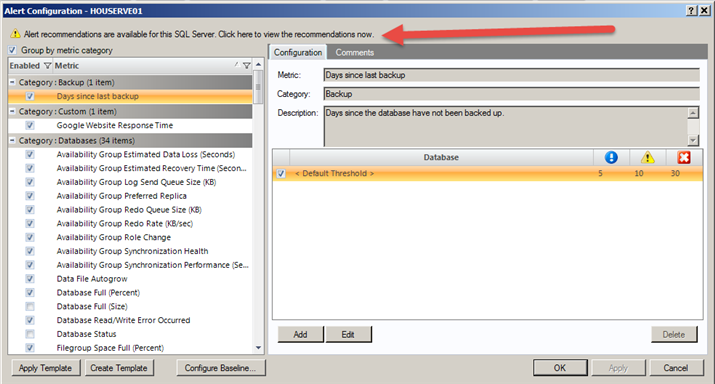
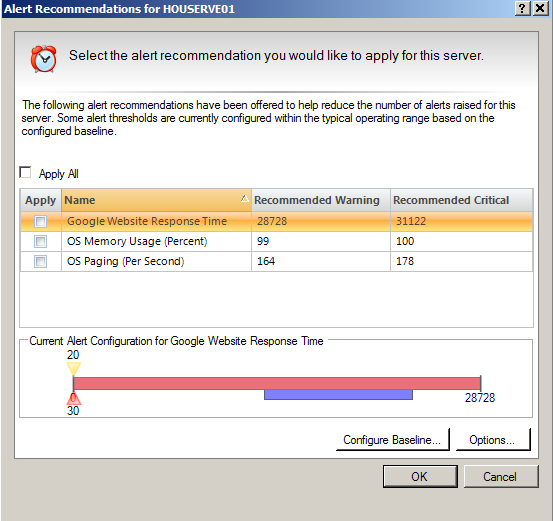
- It is used to calculate the Alert Recommendations. When the normal variation of your performance metrics varies greatly from your selected thresholds, then you will receive an advisory to adjust those thresholds. The suggested thresholds will be based on default mean and standard deviation values.
- It is always in effect whenever no other specific baseline is scheduled.
- It is always displayed as a band on the threshold graphic. Since other baselines can be in effect at different times, only the default is used to display for comparison to the static threshold values in Alert Templates.
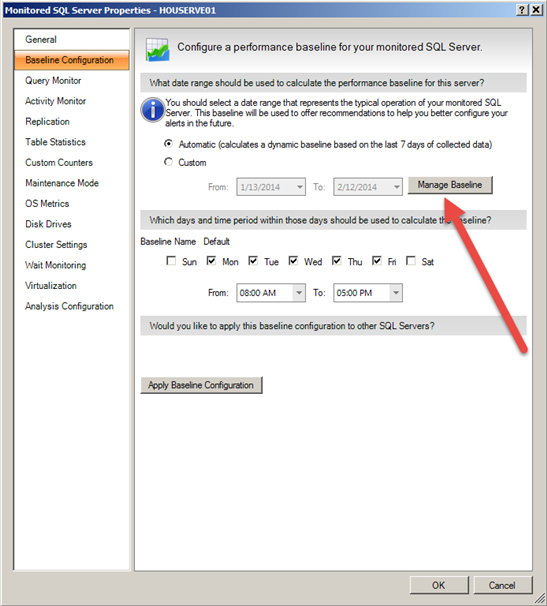
You can either use a dynamic baseline on the past seven days of data or you can specify a particular time period if you want more review control before changing alert thresholds or want to preserve a particular high point of activity for threshold settings.
Alert Recommendations
One way to use baselines effectively is to periodically, but manually, adjust your alert thresholds after reviewing recommended settings. The recommended changes will always be based on some set percentage of the baseline which is always set as the mean plus one standard deviation.
Only the alerts that normally exceed current thresholds will generate alert recommendations. Users can accept all recommendations or choose certain ones to change.
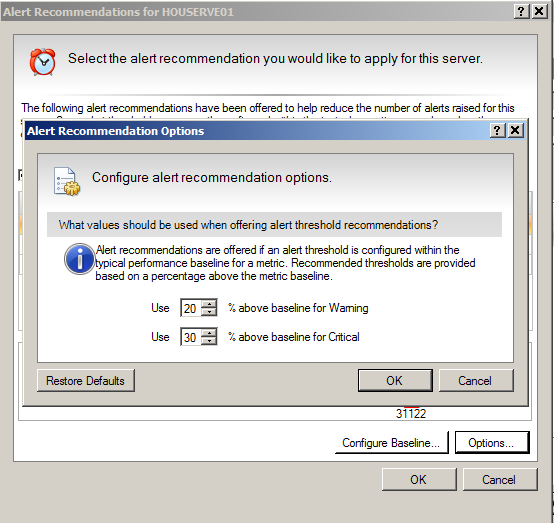
Recommendations are set to default at 20% and 30% above the calculated baseline. But that can be configured as well if the user is more concerned about false positive alerts or false negative alerts.
Different baselines for different activity levels
The default baseline and alert recommendations are a good way to tune static thresholds based on measured performance of particular databases or systems. But what if you want to be alerted differently for abnormal performance during particular periods of the day or week?
Using the baseline visualizer
The first step in setting up baseline periods is to decide what days and times to use for those periods. You may already know what you want because you know when batch jobs are run or when peak online activity is in effect or conversely when the database or system should be relatively idle. If so, you can directly set those times as described later.
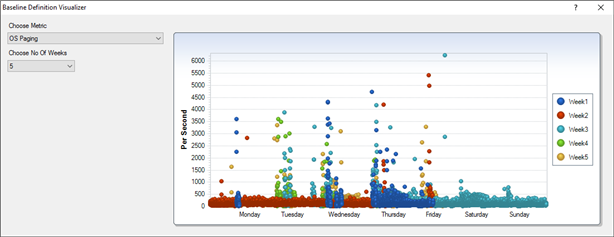
But if you need a visual guide to spot any abrupt and recurring changes in activity level, use the baseline visualizer to overlay the week-over-week measurements of any selected metric. You can also use this tool as a general comparison for week-over-week performance of any given metric.
Remember that the important thing to look for on this chart are recurring clusters of activity at different times of the day or week.
Setting up multiple baselines
Now that you know which times of the day and days of the week you want to user for your names baselines, it is relatively simple to set them up in SQL Diagnostic Manager.
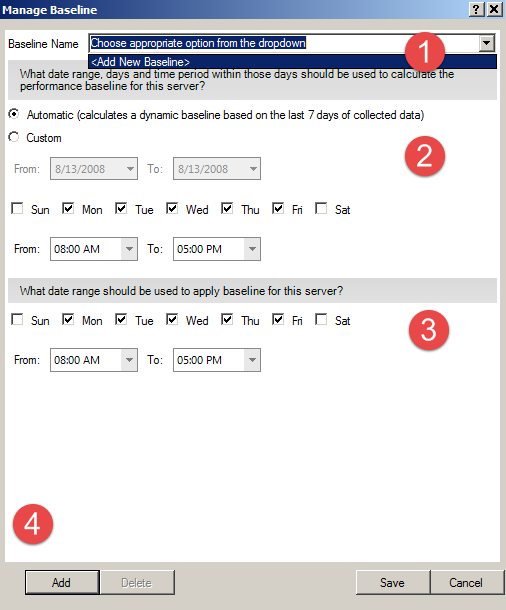
The first step is to select the Manage Baseline button on the baseline configuration screen.
The process for defining a named baseline is all completed on this screen:
- Use the dropdown to select <Add New Baseline>. (Note: To edit an existing baseline then select that name from the dropdown list.)
- Decide whether to use a specific data range or a dynamic seven-day baseline. You can make different choices for different baselines.
- Choose the time range and days of the week to select the data to be used in the calculation.
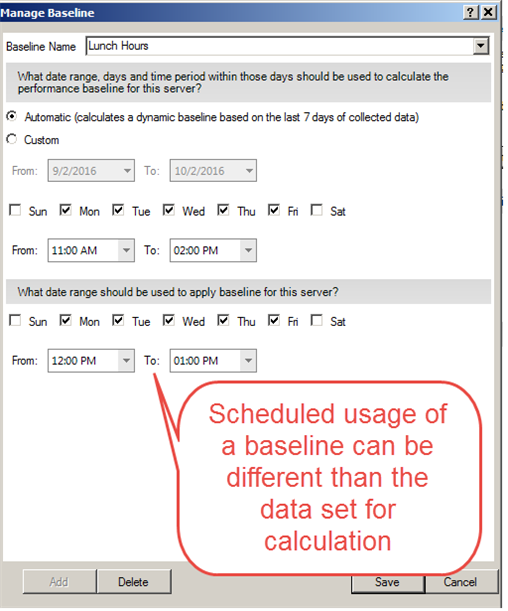
- Decide when this baseline will be in effect. Normally this will be identical to the calculation days and time range. But you may choose to limit the calculation to certain peak periods and yet schedule it for a broader range.
- Click “Add” to add the baseline to the list.
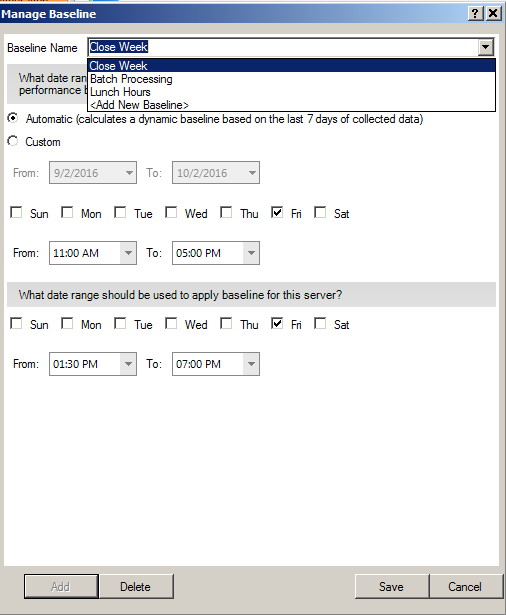
The following example includes separate baseline calculations for batch processing and lunch hours based on dynamic seven-day calculations and a set date range for a Close Week baseline for end of quarter activity that might be different than the dynamic calculation.
Setting thresholds directly from baselines
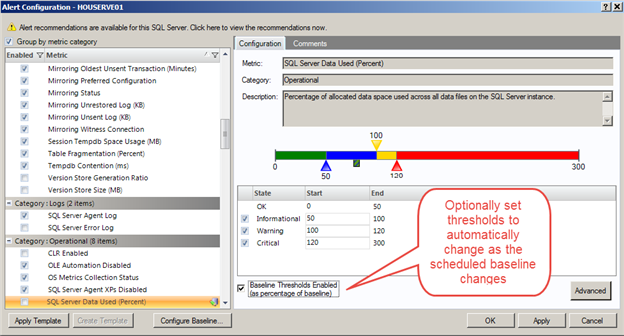
If you don’t want to keep getting Alert Recommendations and reacting to them, you can directly set your thresholds based on baseline calculations.
Using this option will not only change the threshold as the data within a particular baseline changes, it will also follow the schedule to change thresholds at different times of day or days of the week.
Global baseline settings
While these settings should help users calibrate alerts to the normal performance of a given system and help shorten the process of tuning alert thresholds, it could be tedious to set it up separately for each instance managed.
We have encountered some vendors calling out a feature of “global baselines” to mean calculating baselines on one instance and then using those exact static thresholds on multiple other instances.
We, at IDERA, wouldn’t really call that functionality a “global baseline”, although users can already do the same thing using alert templates. Using Alert Recommendations to adjust a given alert template, the user can choose to apply that template with identical settings to as many instances or groups of instances by tag as they prefer.
It makes more sense, and better fits the definition of “global baseline” , to set up the baseline calculation periods and definitions once but apply them to other instances and recalculate separate baselines for each instance based on its own collected history.
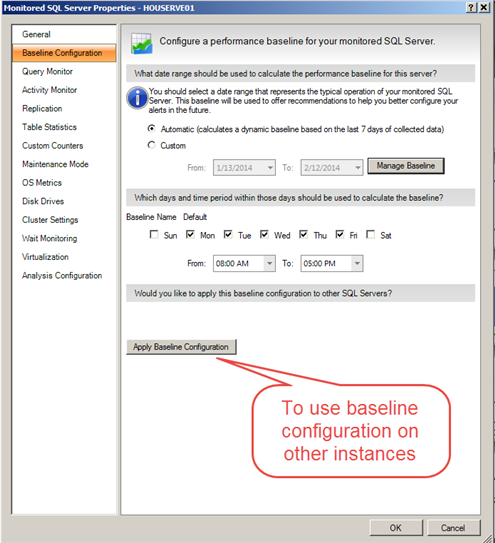
To apply the baseline configuration from one instance to other instances, just select “Apply Baseline Configuration” from the baseline settings window.
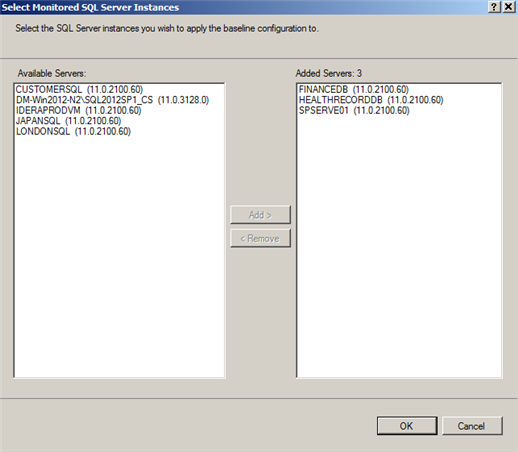
Select which instances or servers you wish to set with an identical baseline configuration and click the “Add” button to move it to the new list.
Note that you can edit the baseline configuration of any instance directly after the initial configuration is applied.
In this way, you can set up model instances for baseline configurations and then use the same settings to many other instances.
Future considerations
Look for further baseline enhancements in the future in SQL Diagnostic Manager. We will be simplifying the user interface for easier definition and review of baseline definitions. But we are also considering other baseline enhancements.
- Dynamic baselines automatically updated on an hourly basis
- Dedicated baseline visualization screen with each metric plotted against it baseline range
- Separate baseline alerts to permit simultaneous usage of static alerts for best practice failsafe settings in addition to detecting deviations from ”normal” behavior.
What else would you like to see in the area of baselines? Let us know in Feature Requests or the product forums.

