The Hospitality Survey Client project is part of the Hospitality Survey App template for Delphi 10.2.1 Tokyo that Embarcadero has released through their GetIt platform. The Hospitality Survey App consists of four different projects plus a Survey Question Editor. And now there is a sixth project I am releasing for the Hospitality Survey App which is a Hospitality Survey Admin Client built in Delphi 10.2 Tokyo. The original business stats dashboard included with the Hospitality Survey App is built in AngularJS but I wanted to also build this same dashboard in Delphi.
I based the Hospitality Survey Admin Client off of the Hospitality Survey Client source code and just modified it a bit. The original client only downloaded the survey questions and then uploaded the results. I modified the client so that it downloads the admin business stats, a CSV file of the email addresses for the users who filled out the survey, the list of completed surveys, and the details of each individual survey. I only needed to add 4 new REST API calls to do this. The code to dynamically generate the client survey form was modified to display the survey results dynamically. The relevant new API calls in the Admin Client are listed below:
GET /survey/results/* – Download the survey results in a paged fashion in FireDAC JSON format. The page number is placed where the * is.
GET /survey/stats/all – Download various stats about the survey results in FireDAC JSON format.
GET /survey/details/* – Download the questions and answers from a specific survey ID in FireDAC JSON format. The survey ID is placed where the * is.
GET /survey/emails/csv – Download a list of all of the email addresses from completed surveys in CSV format.
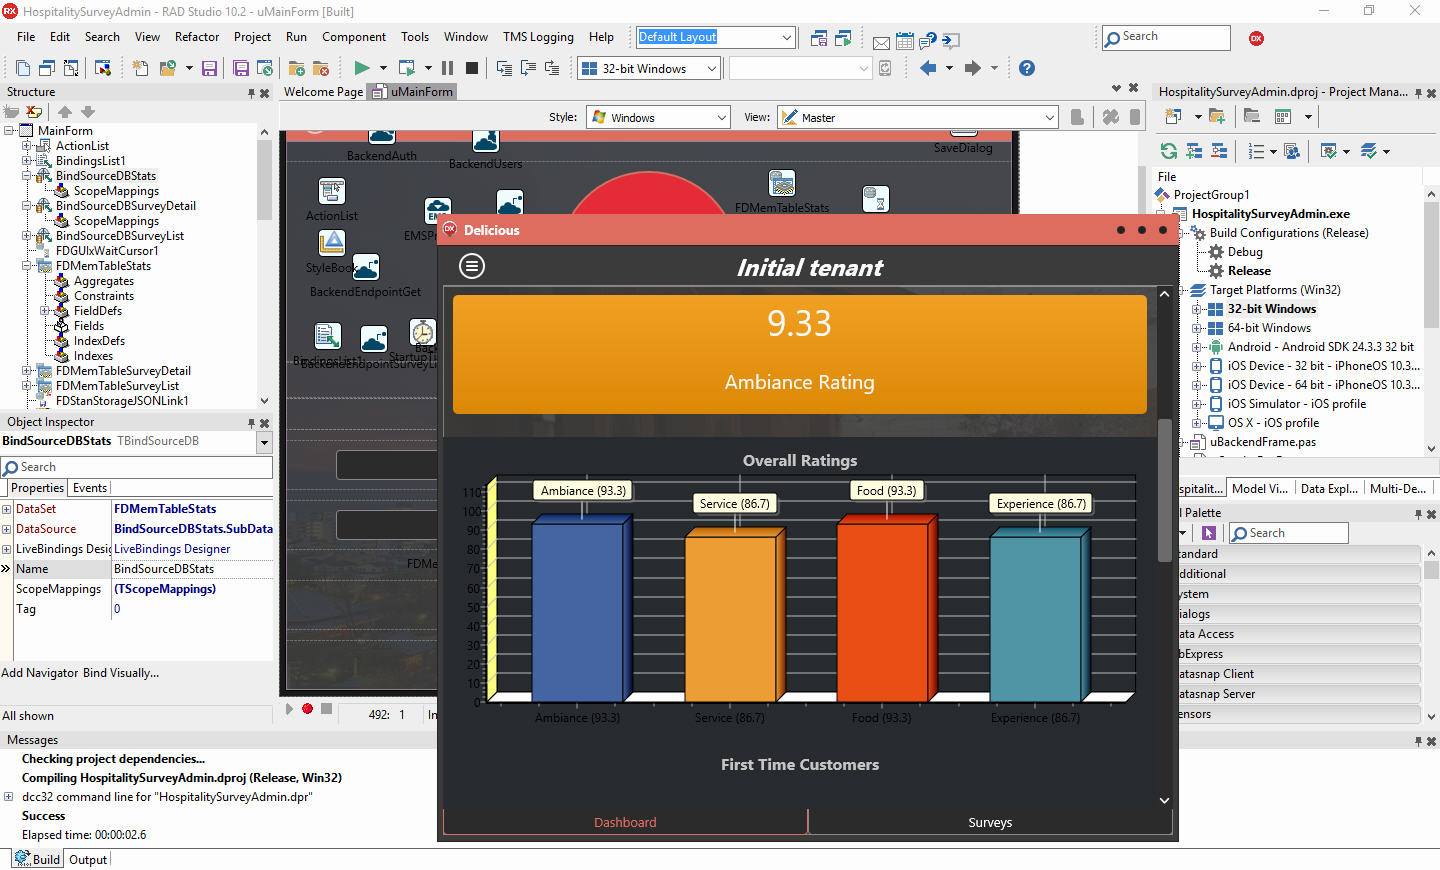
The JSON that is returned is already in FireDAC JSON format (from RAD Server) so it can be easily loaded into a TFDMemTable. The stats dashboard itself uses various FireMonkey objects to display some of the stats and it also uses TeeChart Lite which comes with Delphi 10.2 Tokyo to display the 3 charts. I tried to achieve the same look and feel of the dashboard in the Admin Client as the original AngularJS admin client. Here is the code below to load up the stats into the business dashboard. As you can see TeeChart Lite is pretty easy to use and the charts work across Android, IOS, OSX, and Windows with a single codebase and single UI. What is not visible in the code for TeeChart Lite is that the first Series chart has to be created by right clicking the chart component and selecting Edit Chart… and then choosing the Add… button to create the first chart Series. Once you create the first chart and select the chart type you can then start adding data to the chart via code.
//
//
procedure TMainForm.LoadStats(Sender: TObject);
var
  FrameItem: TFrame;
  FieldType: String;
  FieldCategory: Integer;
  JSONArray: TJSONArray;
  I: Integer;
begin
  ExpValueText.Text := getavg_exp_rating().ToString;
  FoodValueText.Text := getavg_food_rating().ToString;
  ServiceValueText.Text := getavg_service_rating().ToString;
  AmbValueText.Text := getavg_ambiance_rating().ToString;

  BarChart.Series[0].Clear;
  BarChart.Series[0].Add(getAmbiancePercentage(),'Ambiance ('+getAmbiancePercentage().ToString+')');
  BarChart.Series[0].Add(getServicePercentage(),'Service ('+getServicePercentage().ToString+')');
  BarChart.Series[0].Add(getFoodPercentage(),'Food ('+getFoodPercentage().ToString+')');
  BarChart.Series[0].Add(getExperiencePercentage(),'Experience ('+getExperiencePercentage().ToString+')');

  FirstTimeChart.Series[0].Clear;
  FirstTimeChart.Series[0].Add(getfirsttime_yes(),'First Visit ('+getfirsttime_yes().ToString+')');
  FirstTimeChart.Series[0].Add(getfirsttime_no(),'Multiple Visits ('+getfirsttime_no().ToString+')');
  FirstTimeChart.Series[0].Add(getFirstTimeNoAnswer(),'No Answer ('+getFirstTimeNoAnswer().ToString+')');

  RecommendChart.Series[0].Clear;
  RecommendChart.Series[0].Add(getrecommendus_yes(),'Would' + #13#10 + 'Recommend Us ('+getrecommendus_yes().ToString+')');
  RecommendChart.Series[0].Add(getrecommendus_no(),'Would Not' + #13#10 + 'Recommend Us ('+getrecommendus_no().ToString+')');
  RecommendChart.Series[0].Add(getRecommendNoAnswer(),'No Answer ('+getRecommendNoAnswer().ToString+')');
end;
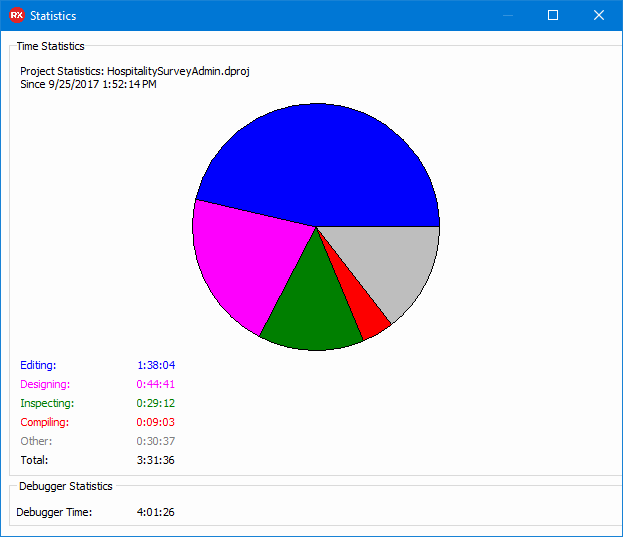
Delphi 10.2 Tokyo has a built in project statistics package which shows you where you are using your time in the IDE when you are developing a project. Below is a screenshot of the time it took to modify the Hospitality Survey Client and turn it into the Hospitality Survey Admin Client. There was some extra debugging time needed to work out some display issues with TeeChart Lite on Android but other than that it was a pretty fast build.
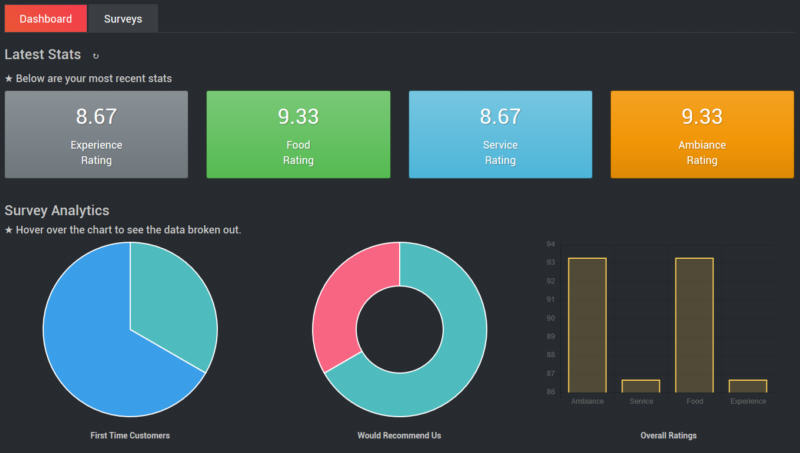
Here is a screenshot of the original AngularJS Hospitality Survey Admin dashboard. It is styled with Bootstrap and uses a Javascript chart library.
Finally, here is a screenshot (see below) of the Delphi 10.2 Tokyo Hospitality Survey Admin Client which uses FireMonkey styling and TeeChart Lite for the business stats dashboard.