10.3.2 includes async parameter completion, tooltip insight and go to definition for Clang-enhanced compilers, as well as significantly revised code completion
In November, we released C++Builder 10.3.0 with an updated Clang-enhanced C++ compiler. That toolchain supported code completion, but missed several other Code Insight features. In 10.3.2, we’ve updated that compiler, adding Win64 support — and we’ve also significantly revised and improved not only the code completion support, but also added back, and improved, key Code Insight productivity features.
Code Insight
Code Insight is a broad term, but for the purposes of this blog post I’m referring to:
- Code Completion – as you type, showing a list of identifiers (methods, properties etc) you might be typing, to speed up typing code
- Parameter Completion – showing the method overloads for the current method, and highlighting the current parameter as you fill it in
- Tooltip Insight – mouse over a symbol to see its declaration
- Code Browsing (go to definition) – ctrl-click on a symbol to go to where it is declared
- Error Insight – where errors in your code are shown with ‘red squigglies’ without you needing to compile, much like spelling errors in Word
There are other features, such as expression evaluation used when debugging, that are not affected by or part of this discussion. We’re interested in the above five only. These are key coding productivity features.
History
The classic C++ personality, and still the Delphi personality today (planned to change soon), provide code completion and other Code Insight functionality though the compiler itself. The IDE hosts a version of the compiler built as a DLL, which is also used when building within the IDE. Taking code completion as an example, effectively the IDE asks the hosted compiler to compile to the current point in code where the cursor is located and code completion was invoked, and asks for what symbols are visible from there. This is a slight simplification, but the gist is correct. Access to the compiler is single-threaded, and the API is run in the main thread and is a synchronous API, ie non-async, meaning that once the editor asks for the information from the compiler, it has to wait until that returns to both show the information, and to respond to any further user input. This means the IDE blocks while calculating the info it needs.
(As a tip: you can actually cancel this by pressing Escape. Try this if you see completion taking a long time and you’re waiting for the IDE to respond. The details of how this works when the IDE is calling into the compiler are far outside the scope of this blog post. This is no longer necessary, of course, with the new technology used for Code Insight for C++ in 10.3 and 10.3.2.)
This was a great design when introduced, when code completion was a new feature, and works well when the compiler can return fast. C++ is a slower language than Delphi, but the classic compiler still worked reasonably well. As codebases grew, though, this design became increasing stretched.
When the Clang compiler was introduced in C++Builder, the same Code Insight API was kept inside the editor. This time, there was a compatibility layer translating from this API to Clang. This added overhead; plus, Clang was not designed with this in mind and was not as fast at this as the classic compiler.
We needed a better solution.
Code Completion in 10.3
When 10.3 was released with the upgraded Clang compiler, at the same time we addressed some of the above. We introduced a new design, initially limited to code completion, that was:
- Asynchronous and non-blocking, ie you could invoke completion and still type
- Out of process – all calculation happened in a dedicated process managed by the IDE, meaning the IDE used less memory and any CPU usage was in a second process
- Used an industry standard, the Language Server Protocol, which is a way for any IDE or text editor that needs to ask about code and display results like completion (LSP client) to talk to any app that provides this kind of code analysis and results functionality for any language (LSP server)
This was a huge step forward. Code completion was non-blocking; the IDE remained responsive; work was done in a second process so the IDE remained responsive and used less memory; and the results it gave were more accurate. In 10.3 it was limited to code completion only, and had a few quirks, but it was still much better than the previous design.
In 10.3.2 we’ve revised and expanded this significantly. Since code completion already used it in 10.3, let’s look at that first.
Code Completion in 10.3.2
In 10.3.2, code completion for Clang is full-featured.
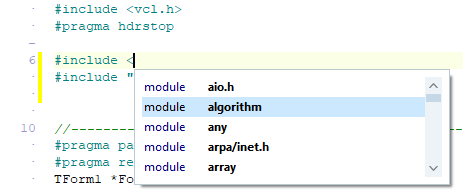
Code completion is invoked automatically when you press ., ->, or ::, as well as < in a #include <> statement to complete headers. You can always invoke it manually via Ctrl+Space. This will show you a list of what is available at the current spot; type to filter or press up and down arrow to change the selection, and press Enter to have the IDE fill it in for you.

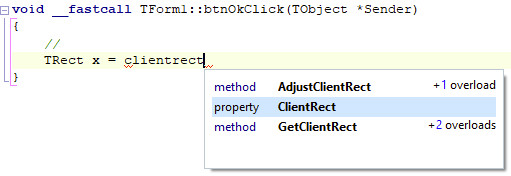
We’ve addressed a number of quality issues in the first implementation. We’ve also added some new features: the number of overloads of a method are listed, and you can see the code completion list is now drawn nicely styled to match the IDE styling introduced in 10.3.
A really nice addition is a change to how the list is filtered. As you type while the completion list is both calculating or displayed, the results are filtered to match what you’ve typed. In the past, this filtered only by matching what you typed against the start of any identifier name. Now, it will match by finding what you typed anywhere in the name. That is, following the screenshot above, if you type ‘clientr’ in the editor and complete, in the past only the ClientRect property would have been displayed. Now, two additional methods that contain the same text are displayed.
This allows you to use completion to explore what’s available. If you know there’s a property or method called ‘something-text, maybe?’ you can invoke code completion, type ‘text’, and see everything that matches. It’s a great way to explore what’s available for a specific class or variable.
There are some scenarios where code completion may not display or produce the expected results. This includes when the file does not yet exist on disk (save the file once – if it’s modified in the IDE after, that’s ok, it just has to have a file descriptor on disk); when .cpp and header files that form a pair are located in different folders; and when the code relies on a precompiled header to compile correctly. I’ll post about resolving code insight issues in a later post. You can generally resolve all of them by looking for Error Insight errors and solving those, because that uses the same technology. However, the majority of code now works very well.
New Code Insight Features in 10.3.2
In 10.3.2, we also reintroduce the following Code Insight features for the Clang compiler:
- Parameter completion
- Tooltip Insight
- Code Browsing (ctrl-click)
Parameter completion
When you have a method, you can ask the IDE to tell you the types and names of its parameters, including if it has multiple overloads. The IDE will also indicate which parameter you are currently typing.
Just like code completion, calculating this is asynchronous and non-blocking. It’s invoked automatically when you select a method in code completion, and you can invoke it manually inside a method by pressing Ctrl-Shift-Space.
Error Insight
Error Insight is the ‘red squiggly’ feature in the IDE. Normally, you have to build your code to find errors in it. Error Insight shows these to you in the editor before you compile.
In 10.3, along with the new code completion we also introduced error insight for the first time for C++. However, it was a very minimal feature, one we added because we had the data. In 10.3.2, it’s extended, and the elements it underlines are now larger and more indicative of the error location.
You might have noticed error insight in the screenshots above for code and parameter completion. That’s because the code as written is (in the screenshots) incomplete, and so has errors. Completing correctly or adding a semicolon at the end will resolve those errors.
Error Insight updates in the background. Like code and parameter completion, it’s non-blocking; you should never see the IDE slow down or pause because of it. It’s a fully background feature, quietly working and showing you information without any impact.
Tooltip Insight and Code Browsing
Tooltip Insight will show you the declaration of a symbol when you mouse over it.
Code Browsing takes you to that declaration. Hold Control and mouse over a symbol; it will turn into a blue underlined hyperlink. Click it to navigate.
Both these, like the rest of the Code Insight features in 10.3.2, are asynchronous and will not block the IDE. However, for these two that’s less important, because they are also always immediate. They work via indexing, which means the results are always available.
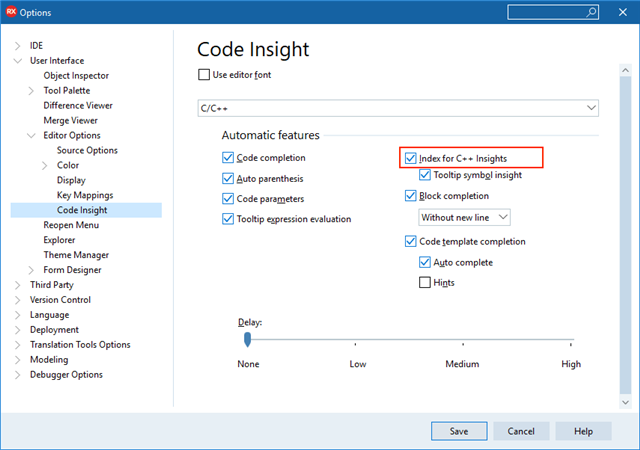
Indexing is the process of going through your entire project and creating an index of information about it. This happens each time you open your project. If you don’t want this to happen, such as if it uses too much CPU, you can turn it off in the IDE Options, Code Insight page, uncheck ‘Index for C++ Insights’ checkbox.
If you do this, Tooltip Insight and Code Browsing won’t function until it’s turned back on. This setting does not affect code completion, parameter completion, or Error Insight, which do not require indexing and always function regardless.
Overview
10.3.2 has some really great improvements to C++ editor insights, which are great for productivity. Not only do these have some nice behaviour tweaks compared to the classic version, but these are also significantly improved in that they are asynchronous and non-blocking, ie a fully modern implementation. Using the IDE should feel always responsive. We hope you find the new features useful!


