In 10.4, we’ve reworked code completion and other features. It’s one of the most significant changes to the IDE in a decade.
What do we mean by Code Insight?
First, some background. If you’re familiar with Code Insight, skip ahead…
Code Insight is our name for a set of IDE productivity features in the editor. For the purposes of this blog post, those features are:
- Code Completion: the dropdown list box that predicts what you want to type. Appears when you type a period (.) after an identifier, or when you press Ctrl+Space.

- Parameter Completion: the hint that appears showing the parameters for a method, including multiple variations for an overloaded method. Ctrl+Shift+Space inside method braces ().

- Find Declaration: right-click on an identifier and click Find Declaration, and it will take you to where that method, variable, type etc is defined. You can also hold Control down and move your mouse over the editor, and applicable identifiers will turn into hyperlinks you can click on to find their declaration, which is known as Code Browsing.
- Tooltip Insight: hover your mouse over a variable or type, and you will be shown information about it. Sometimes this includes XMLDoc, and is known as Help Insight. (We need to clarify names in our doc.)
- Error Insight: displays errors in your code before you compile. These are otherwise known as ‘red squigglies’, many people’s preferred terminology – the red zigzag lines under your code. Errors are also shown in the Errors node in the Structure view.
These features have been available in Delphi for many years. Features like this are a key benefit to you when coding an IDE. Code completion especially saves a lot of typing, and error insight helps you make sure your code is working before you spend time compiling.
Classic Code Insight
As the language has grown and time has passed, these features have no longer always worked as well as we have wanted. The technology was cutting-edge when it was introduced, but there were definite improvements we could make today.
It’s been common to see bug reports about spurious errors (ie errors reported in the editor or in the Structure view when the source code is actually perfectly correct code.) Or that the IDE worked in the main thread, so would not respond to keystrokes while it was working to show the code completion list. (You could only press Escape to cancel.) Sometimes, for gigantic projects, calculating the data for code completion could use a lot of memory in the IDE. In addition, the features were implemented with multiple code parsers: code completion and error insight each had a different understanding of the code. And finally, code insight was disabled while debugging, so if you wrote code while debugging you had no productivity assistance.
We did not want this to continue. Our goals for 10.4 have been to:
- Make Code Insight asynchronous – that is, run on another thread or in another process (or both) so that the IDE is always responsive when you type even if it’s doing work in the background
- Reduce or even completely remove (you can see where this is going) the potential memory usage for code completion from the IDE
- Ensure Error Insight always gives correct results – that is, it should give exactly the errors the compiler would, and correct code should show no errors
- Help us move closer to having a single parser for Delphi source in the IDE, so that there is a ‘single source of truth’ or single understanding of what Delphi code means within the IDE
- Modernize Delphi’s code tooling approach to use modern techniques
- And solve a number of bugs in code completion at the same time
- And add at least one code completion feature… Wait! Add two new code completion features at the same time!
All of this is in Delphi 10.4.
Excited? We are. This is one of the biggest and best changes to the Delphi IDE in fifteen years.
(And don’t worry – if you need, classic code insight is still there, complete with a few new bug fixes, and can be turned on in 10.4 if you want.)
community.idera.com/…/10-4-LSP.mp4
Code Insight Technology in Delphi 10.4
In 10.4, the above Code insight features are implemented using a ‘LSP Server’. You may have heard of this technology, but if not, LSP refers to the Language Server Protocol, which is a standardized way to implement code insight-like features for many languages. An IDE talks to a ‘language server’, which is a small helper app that calculates and generates the information the IDE displays. It does so using a defined protocol, and that’s the language server protocol.
In other words, the IDE now talks to a helper app when you do something like open a project, or type a keystroke in your file, and the IDE can periodically ask it questions, such as: ‘What are the completion results at this location?’. That helper app keeps track of your code, and sends back an answer to any questions, plus any errors it ran into in the code along the way.
Our server app is built around the compiler, using the compiler as a service to provide LSP results. That means that what the IDE displays to you, including ‘red squiggly’ errors, is all data that comes from the compiler itself.
This means a few things:
- Communication with another process is asynchronous. In the IDE, it’s implemented in another thread. You can keep typing, even close your file or open another project, while the IDE is waiting to hear back on the data it’s requested
- The work is done in another process. This means all the memory usage for calculating results is no longer in the IDE itself. The IDE has more memory, and the helper app can use its entire memory space dedicated solely to providing results
- It uses a modern, standardized protocol which applies to many languages
- What you see onscreen is what the compiler sees. That means it should be accurate. If your code compiles, you won’t see any Error Insight errors; conversely, if you do see red squiggly underlines in your code or in the Structure view, your code will not compile.
- You can get code completion while debugging.
These are all very good things.
But enough text. Let’s see what it looks like in action!
Modern Delphi Code Insight In Action
It’s hard to show responsiveness in a blog. In these static screenshots, just imagine that you’re typing and you never see Windows wait cursor.
Imagination will become reality when we ship 10.4!
Code Insight While Debugging
The first new feature is a big one, that doesn’t need many words. You can use Code Insight while debugging.
Want to debug your app and type code at the same time, and get code completion? You can.
Yes, what you’re seeing is correct – that’s code completion and error insight both working while you are actively debugging the application.
Completion Results
Getting code completion is the same as in 10.3.3, with the exception that the IDE remains responsive in 10.4. But we’ve added another new feature, which allows you to find what you want through code completion more easily. In 10.4, code completion will now show more useful results than in the past – yet while still keeping 10.3.3’s items at the top of the results list.
Here’s 10.3.3’s code completion, typing ‘act’ after a VCL TButton instance:
Note that 10.3.3 shows very few results – only one, in fact. Classic code completion listed only items that start with what you typed.
Here’s 10.4 in action (pun intended) for the same completion:
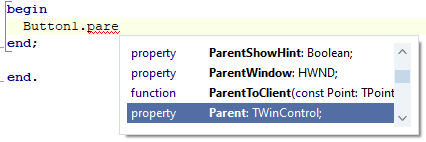
In 10.4, code completion lists all items that contain what you typed. Other IDEs do this too, Visual Studio for example, but until now Delphi has shown a more limited list. This is useful because it allows you to search through completion.
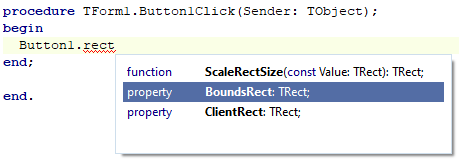
For example, suppose you remember that a control has a something-Rect property but you can’t remember what it’s called. In 10.3.3, you’d have to google. In 10.4, just type ‘rect’ and you’ll see:
You can explore your code by typing.
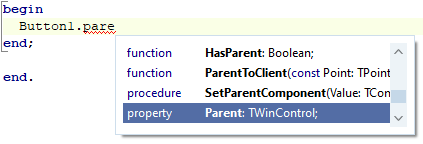
Having more results may not always be what you seek, and you may expect only items that start with what you typed from habit. By default, and to keep the behaviour close to what you’re familiar with from 10.3.3, we sort the completion list so that all starts-with identifiers are placed above all contains identifiers. In other words, the list will give the same results as 10.3.3, but with extra results appended. You don’t need to use those if you don’t want to; they are located after the items that 10.3.3 would have shown you.
If you want behaviour like other IDEs, listing all results together, we have a setting: currently a registry key but we may expose it as UI. That means if you’re more used to what VSCode provides, you can get that too.
 |
 |
| In 10.4, sorting all items that start with what you typed together, at the top of the list. This is what you’d see in 10.3.3, and is the default in 10.4. | In 10.4, sorting by scope only, so that all items that contain what you typed are shown together. This is more similar to Visual Studio or other IDEs, and is off by default. |
Selection in the completion list
Code completion automatically selects the best items in the list for you (so you can just press Enter or Space or ‘.’ or similar to choose that item and keep coding) in the following order:
- An exact match against what you typed. If there’s no match:
- Out of items that start with what you typed, the shortest identifier. If there are no starts-with items:
- Out of items that contain what you typed, the shortest identifier
Prioritising starts-with over contains means the completion list will automatically select ‘Parent’ over ‘SetParent’. Choosing the shortest match means it will select ‘Parent’ over ‘ParentFont’. (You can see this in the above screenshots.) Generally, we find this matches what you are most likely to be typing. Of course you can scroll and press the up and down arrow to select anything you want.
Error Insight
Note in these screenshots you can see live Error Insight, which updates as you type. The partially-typed identifier ‘pare’, which is not valid code, is correctly underlined in red. (The underline will go away when you select an item from the completion list.) Error Insight results come from the compiler itself, and reflect and report exactly what the compiler sees.
You should never see incorrect errors in the editor or the Structure pane. What you see onscreen is accurate.
Multiprocess Architecture
The following is not important for features, but may interest you on a technical level.
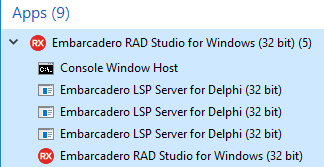
I mentioned that the LSP server runs as a separate process, which has a number of benefits including a dedicated 4GB memory address space for code insight. If you look at 10.4 running in the Windows Task manager, you will see multiple DelphiLSP processes. The first controls multiple agents, and we have one agent dedicated to providing completion and other results, and one agent dedicated to providing error insight.
To my knowledge, we are the only LSP server that uses a multiprocess architecture.
Quality
While implementing this, we have also found and fixed a number of issues that affected code completion in the past.
Next Steps
The new code completion is different to 10.3.3 and earlier’s code completion. We’ve worked to make it as similar as possible, including tweaks like sorting starts-with items above others, to make it familiar to you when you first use it. We hope that within a few minutes you’ll get so used to it that you never want to go back to 10.3.3! But we don’t want to present this as exactly the same: you will find differences.
The new Code Insight in Delphi 10.4 solves a lot of issues, and makes using the IDE a much more pleasant and responsive experience for you as well. That’s not to mention the extra results, which can be extremely useful. We plan to continue working on it to move forward by the goals written above. In 10.4 though, we and our beta testers have found it’s a great addition to the IDE.
In addition, we even added two new features: allowing you to explore your code through code completion, and using Code Insight including code completion and other Code Insight features while debugging.
We’re really excited about this feature. Asynchronous. Responsive IDE. Modern protocol. Support for other languages. Code completion while debugging. It’s great stuff. We can’t wait for you to get 10.4 and try it out yourself.
| ❝ | The new LSP-based CodeInsight is fantastic. This is going to revolutionize the product.
— Nick Hodges, who has used a beta preview |
If you have update subscription, one of the perks is accessing beta builds of upcoming releases. There’s still time to join our beta program for 10.4!
This is a preview of an upcoming release of RAD Studio. There can always be last-minute bugs or changes. Nothing here is final until the release is officially made available.
UPDATE: 10.4 Sydney is now available! Download your 30 day free trial from our website!


