Automated alerts are essential to performance monitoring. Automated alerts enable spotting issues in infrastructures, identifying their causes, and rapidly minimizing degradation and disruption of services. Alerts draw human attention to particular systems that require observation, inspection, and intervention when metrics and other measurements facilitate observability. Automated alerts save time by removing regular manual checks of metrics. Automate alerts across as many of systems as possible to respond quickly to issues and to provide better service.
The 12-page whitepaper “Seven Steps to Alert Effectively” presents seven steps to improve the effectiveness of alerts. Improve the usefulness of alerts. Prevent noisy alarms that often mask real issues. Avoid sending alerts to the wrong staff which delays responses. Add helpful context to alert messages to prevent redundant manual efforts. Setup automated remediation to avoid unnecessarily high workloads and distractions for staff.
Click here to read the whitepaper.
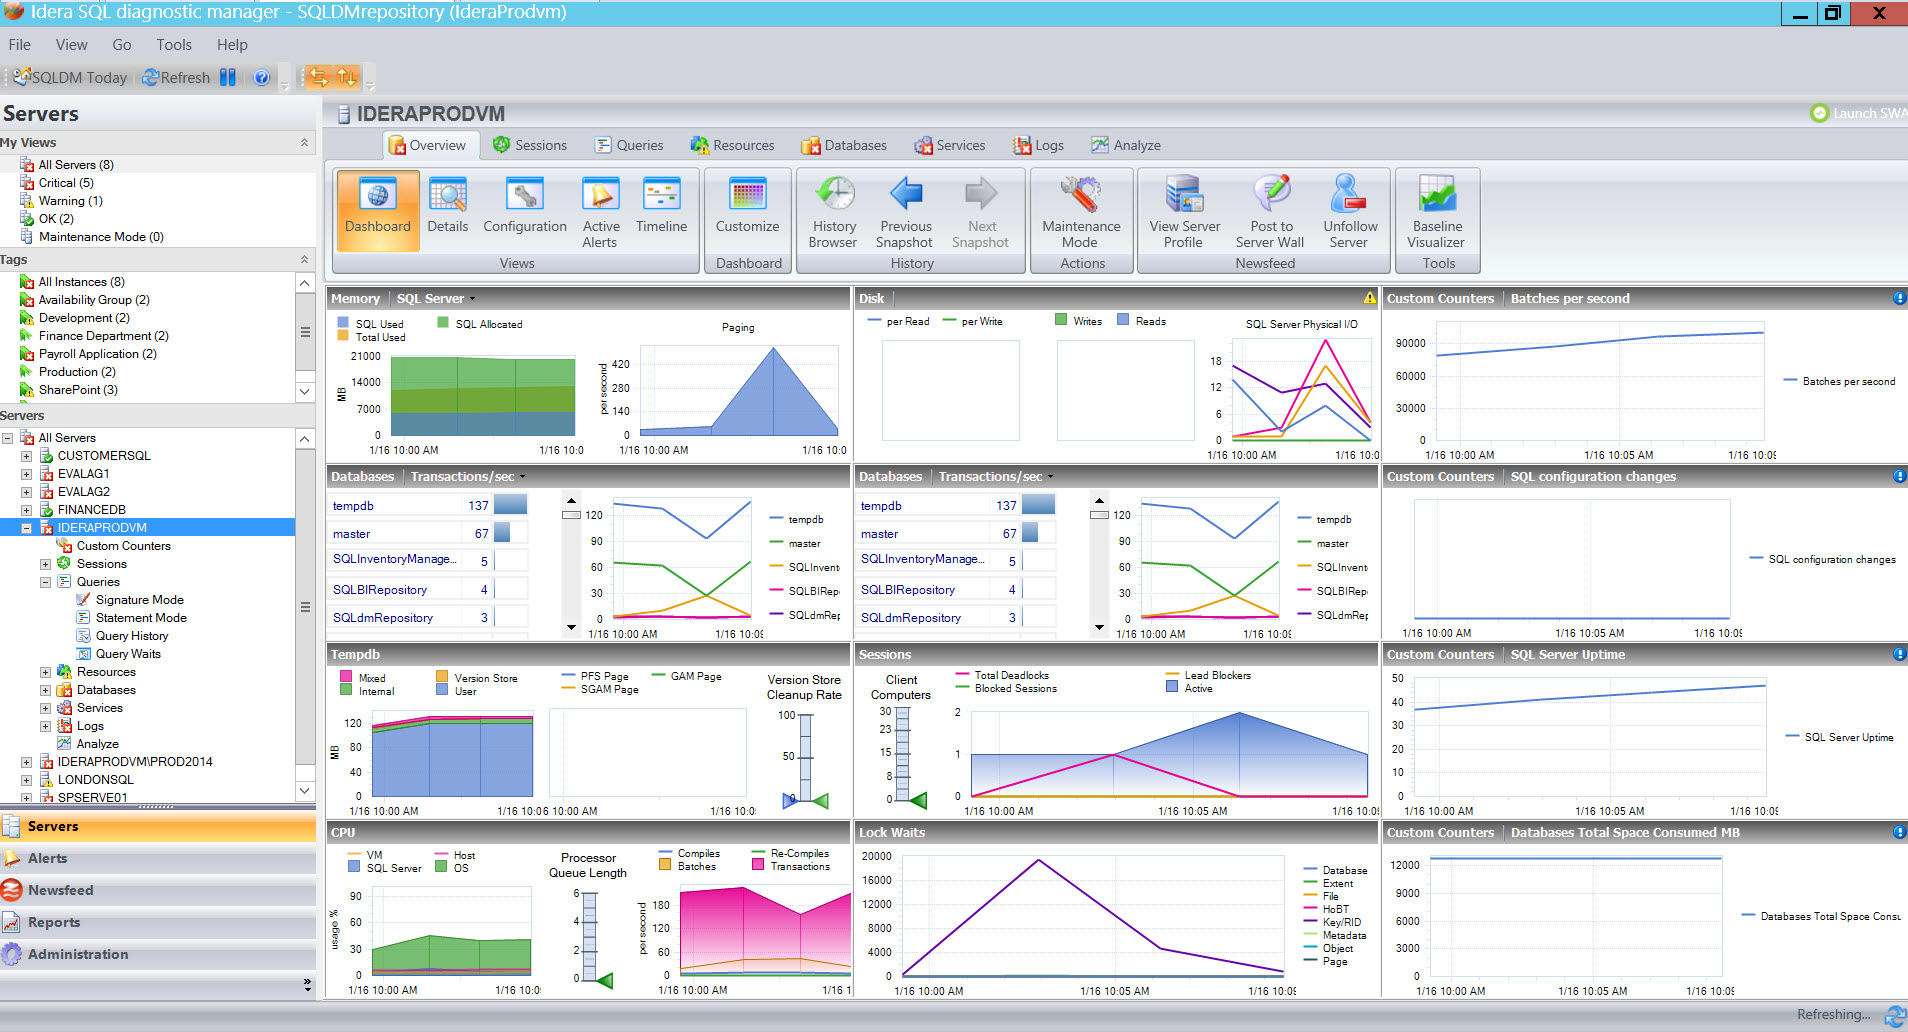
With SQL Diagnostic Manager, configure alerts to inform and warn about approaching issues with SQL Server instances. View these alerts using the desktop, web, and mobile console, and the newsfeed. When reaching alert thresholds, send email notifications, pop up alert messages in the Windows taskbar, write events to the Windows Event log, generate events on the timeline, and send alert messages to the newsfeed action provider. After correcting problems triggering alerts, alert again when situations recur.
Choose from more than 100 pre-defined and configurable alert settings based on industry best practices with advanced configuration settings to allow for greater flexibility. Configure general alert settings as templates to apply to other servers and groups of servers. Set different alert thresholds for each database or disk within each monitored instance. Capture baselines of past performance of monitored instances to determine whether alert thresholds are excessively noisy or cause false positive. When metrics are continually alerting, view flags to indicate that changes may be needed and see recommendations for new limits.
Easily snooze alerts and groups of alerts for a specified time to prevent alerts from recurring while resolving problems. Determine the length of time that an issue must occur before sending first alerts for problematic metrics that occasionally spike for very short durations. Disable data collection and alerting during maintenance periods to avoid false positives. Maintenance mode can be on-demand, one-time, and or weekly scheduled maintenance periods. Enable maintenance mode via PowerShell to integrate with outside job scheduling.
View the infographic “Why Use SQL Diagnostic Manager”, read a case study, browse the datasheet, download a fully functioning 14-day trial, request a one-on-one demonstration, and request a price quotation.
